
- Title
-
TEX264 drives selective autophagy of DNA lesions to promote DNA repair and cell survival
- Authors
- Lascaux, P., Hoslett, G., Tribble, S., Trugenberger, C., Antičević, I., Otten, C., Torrecilla, I., Koukouravas, S., Zhao, Y., Yang, H., Aljarbou, F., Ruggiano, A., Song, W., Peron, C., Deangeli, G., Domingo, E., Bancroft, J., Carrique, L., Johnson, E., Vendrell, I., Fischer, R., Ng, A.W.T., Ngeow, J., D'Angiolella, V., Raimundo, N., Maughan, T., Popović, M., Milošević, I., Ramadan, K.
- Source
- Full text @ Cell

Crosstalk between autophagy and DNA replication upon replication fork stalling by CPT (A) Co-immunoprecipitation of TEX264-WT-V5 in HeLa TEX264KO background in asynchronized or S-phase-synchronized cells (n = 3). (B) Strategy for replisome proteomics analysis. Venn diagram of the replisome found by nascent chromatin capture (NCC) coupled to stable isotope labeling by amino acids in cell culture (SILAC) and mass spectrometry (MS) analysis, NCC-SILAC-MS63 overlapped with all known autophagy factors. (C) Ridge regression plot of known autophagy factors at replication fork identified by SILAC-NCC-MS.63 (D) iPOND performed after 40 min of 100 nM CPT (0.1 μM) or 1 μM CPT. Representative blots from different biological repeats and quantification (n = 3). Error bar, SD. (E) Strategy for purification of intact lysosomes; LysoIP. (F) Proteome profiling of lysosomes purified by LysoIP after 6 h of 50 nM CPT. Proteins differentially expressed (−10log p >1.301) shown with full dark circles. (G) LysoIP performed in S-phase-synchronized HeLa after 6 h of 50 nM CPT. See also Figure S1 and Tables S1 and S2. |

Autophagy repairs TOP1cc to promote cell survival to CPT (A) Immunofluorescence after 2 h of 50 nM CPT. Torin, 250 nM Torin-1. Quantification of positive nuclei for TOP1cc foci (n = 3). Two-way ANOVA. Error bar, SD. (B) RADAR assay after 2 h of 50 nM CPT (n = 2). Torin, 250 nM Torin-1. Double-stranded (ds) DNA; loading control. (C) LysoIP performed after 6 h of 50 nM CPT (n = 3). (D) Cell viability after 48 h of CPT (n = 4). Error bar, SEM. (E) Strategy used to follow TOP1 delivery to lysosomes. The reporter mCherry-TOP1-GFP presents red and green fluorescence except if internalized in lysosomes (pH = 4). (F) Imaging of mCherry-TOP1-GFP after 3 h of 50 nM CPT (nM) or 1 μM CPT (μM) (n = 3). Bafilomycin A1 (BAF), negative control. Quantification of the correlation between GFP and mCherry fluorescence in the cytoplasm. Two-way ANOVA. Error bar, SD. Scale bar, 10 μm. ∗p < 0.05; ∗∗∗p < 0.0005; ns, not significant. See also Figure S2. |
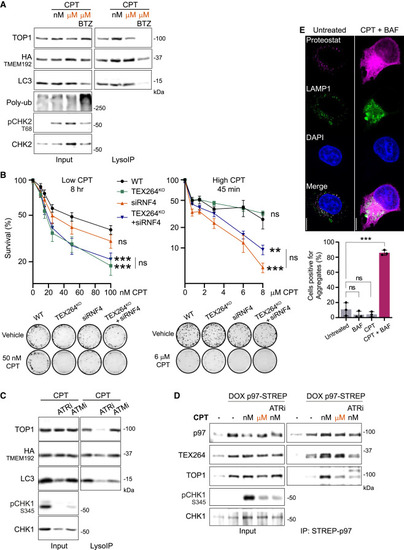
Autophagy promotes cell survival independently of the proteasome activity (A) LysoIP performed after 3 h of 50 nM CPT (nM) or 1 μM CPT (μM) and the proteasome inhibitor bortezomib (BTZ) (n = 3). (B) Clonogenic assays performed simultaneously with low- or high-dose CPT (n = 3). Error bar, SEM. (C) LysoIP in S-phase HeLa cells after 3 h of 50 nM CPT and 1 μM ATR inhibitor VE-822 (ATRi) or 1 μM ATM inhibitor KU-55933 (ATMi) (n = 3). (D) Co-immunoprecipitation of p97-Strep in S-phase HEK293T cells after 1 h of 50 nM CPT (nM) or 1 μM CPT (μM) or 1 μM ATR inhibitor VE-822 (ATRi) (n = 2). (E) Immunofluorescence of protein aggregates using the Proteostat dye after 24 h of 50 nM CPT and quantification (n = 3). Scale bar, 10 μm. Error bar, SD. Two-way ANOVA. ∗∗p < 0.005; ∗∗∗p < 0.0005; ns, not significant. See also Figure S3. |
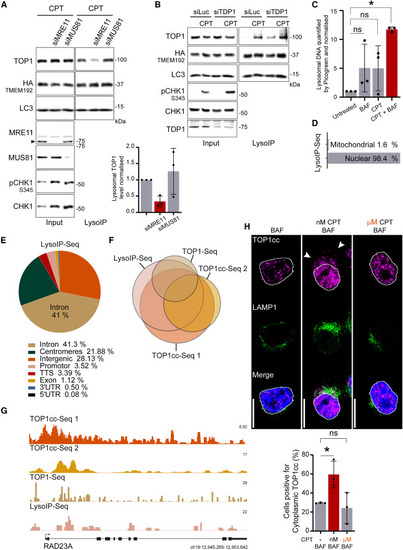
TOP1cc (TOP1 and its bound DNA fragment) are processed by lysosomes (A) LysoIP performed after 5 h of 50 nM CPT, and quantification graph (n = 3). Error bar, SD. (B) LysoIP performed after 5 h of 50 nM CPT (n = 3). (C) Quantification of DNA by Picogreen assay to detect DNA purified by LysoIP after 6 h of treatment (n = 3). Two-way ANOVA. Error bar, SD. Around 450 ng of DNA fragments of less than 1 kb were purified from 20 million cells by LysoIP after treatment with 50 nM CPT and 50 nM BAF. (D) Distribution of the LysoIP-purified DNA, mapped reads sequenced by NGS. (E) Genomic distribution of the LysoIP-purified mapped reads sequenced by NGS. (F) Proportional Eulerr representation of the overlap among the different ChIP-seq of TOP1cc, TOP1cc-seq 1 (MCF7—GEO: GSE135808),87 TOP1cc-seq 2 (LNCAP—GEO: GSE135808),87 and TOP1-seq (HCT116—GEO: GSE57628).88 All conditions were treated with CPT. (G) Genomic browser alignment on genome hg38 of the different TOP1cc ChIP-seq and LysoIP-seq at RAD23A gene loci as sequence tags per million (TPM). (H) Immunofluorescence after 4 h of 50 nM CPT (nM) or 1 μM CPT (μM) and quantification (n = 3). Scale bar, 10 μm. Two-way ANOVA. ∗p < 0.05; ns, not significant. See also Figure S4. |
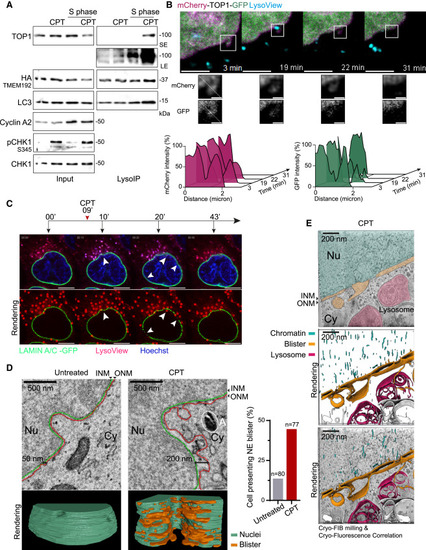
Lysosomal degradation of TOP1cc occurs in interphase cells through the nuclear envelope (A) LysoIP performed after 6 h of 50 nM CPT in unsynchronized or S-phase HeLa cells (n = 3). SE, short exposure; LE, long exposure. (B) Live-cell imaging started 3 min after treatment with 50 nM CPT. Normalized fluorescence intensity measured along the dashed line for both mCherry and GFP. Scale bar, 5 μm; zoom panel, 1 μm. (C) Live-cell imaging. Arrows pointing at the alteration of Lamin A/C-GFP integrity at lysosomal contact sites (n = 3). Rendering by TrackMate of lysosomes and nuclear envelope integrity. Scale bar, 10 μm. (D) Volume electron microscopy images with nuclei segmentation and three-dimensional (3D) rendering after 30 min of 50 nM CPT. INM, inner nuclear membrane; ONM, outer nuclear membrane; Nu, nucleoplasm; Cy, cytoplasm; A, autophagosome. Scale bar, 500 nm. Blister-positive cells present at least 2 enlarged spaces between the INM and the ONM of more than 150 nm, close to a membrane invagination region. (E) Cryo-focused ion beam (FIB) milling and cryo-fluorescence correlation using LysoTracker after 30 min of 50 nM CPT. (Top) Computational slice through a tomogram; (middle) segmentation of the tomogram; (bottom) overlay. Scale bar, 200 nm. See also Figure S5 and Videos S1, S2, S3, and S4. |
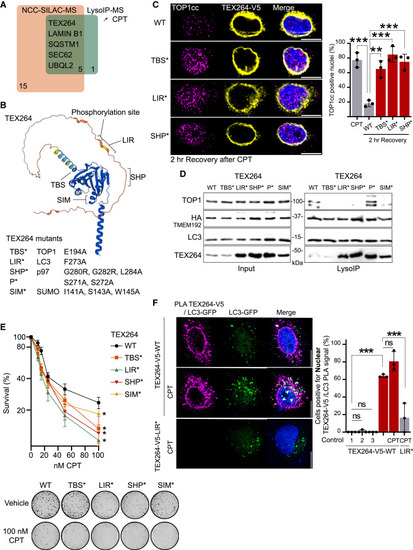
TEX264 is the receptor for TOP1cc degradation by selective autophagy (A) Overlap of known autophagy receptors at replication fork by NCC-SILAC-MS63 and in lysosomes upon 50 nM CPT by LysoIP-MS. (B) AlphaFold prediction of TEX264 structure, with indicated domains. (C) Immunofluorescence after 2 h of recovery after 2 h of 50 nM CPT and quantification (n = 3). Two-way ANOVA. Error bar, SD. (D) LysoIP performed after 6 h of 50 nM CPT in TEX264KO transiently expressing TEX264-WT or indicated TEX264 variants (n = 3). (E) Clonogenic assay after 8 h of CPT (n = 3). Error bar, SEM. (F) Proximity-ligation assay (PLA) between TEX264-V5-WT and LC3-GFP after 30 min of 50 nM CPT (n = 3) and quantification. Control 1, no LC3-GFP transfection; control 2, GFP antibody only (no V5); control 3, V5 antibody only (no GFP). Two-way ANOVA. Error bar, SD. Scale bar, 10 μm. ∗p < 0.05; ∗∗p < 0.005; ∗∗∗p < 0.0005; ns, not significant. See also Figure S6 and Table S3. |

TEX264 expression level defines TOP1cc repair and the clinical response to irinotecan-based chemotherapy (A) Representative images of 2-day-old zebrafish and RT-qPCR quantification of tex264 expression. Two-way ANOVA. Error bar, SD. (B) RADAR assay in 2-day-old zebrafish (lanes 1 and 2, n = 4; lanes 3 and 4, n = 2). Double-stranded (ds) DNA; loading control. Error bar, SD. (C) Univariate Cox regression analysis of survival of colorectal cancer patients classified according to TEX264 mRNA expression. FOLFIRI: folinic acid, 5-fluorouracil (5-FU), and irinotecan. (D) Model. S, SUMOylation. ∗p < 0.05; ∗∗∗p < 0.0005; ns, not significant. See also Figure S7. |

Autophagy recruitment at stalled replication forks promotes TOP1cc degradation, related to Figure 1 and Table S1 (A) Co-immunoprecipitation of endogenous TEX264 in WT cells or in the context of ATG7 depletion (n = 2). Unspecific immunoglobulin G (IgG) was used instead of TEX264 antibody as a control. (B) Overlap of the protein set identified by immunoprecipitation of replication forks interactome by MS64,65,66 and known autophagy-related proteins from the human UniProt-Swissprot database, the Gene Ontology (GO) database, and the Kyoto Encyclopedia of Genes and Genomes (KEGG) database. Replisomes were identified by iPOND, or Bio-ID of PCNA, in different cell lines after treatment with different replication stress inducers. HU, hydroxyurea; UV, ultraviolet. (C) LysoIP was performed in HeLa WT or cells modified for LysoIP experiments by expression of the resident lysosomal tagged protein TMEM192-HA (n = 3). The LysoIP cell line allows the specific pull-down of lysosome vesicles without contamination from other cellular organelles. (D) Immunofluorescence of HeLa WT cells and TMEM192-HA cells used for LysoIP, using anti-HA antibody and anti-LAMP1 marker of the late endosome and lysosome vesicles (n = 3). Scale bar, 10 μm. (E) LysoIP performed after 6 h of treatment with 50 nM CPT in S-phase-synchronized HCT116 cells (n = 3). All conditions were treated with 50 nM BAF. (F) LysoIP performed after 6 h of treatment with 50 nM CPT in S-phase-synchronized cells in hTERT RPE-1 (n = 3). All conditions were treated with 50 nM BAF. (G) LysoIP performed in HeLa released from a single thymidine block into the S-phase and treated for 3 h with 50 nM CPT, 5 μM irinotecan, or 50 nM SN38 (n = 3). All conditions are treated with 50 nM BAF. |
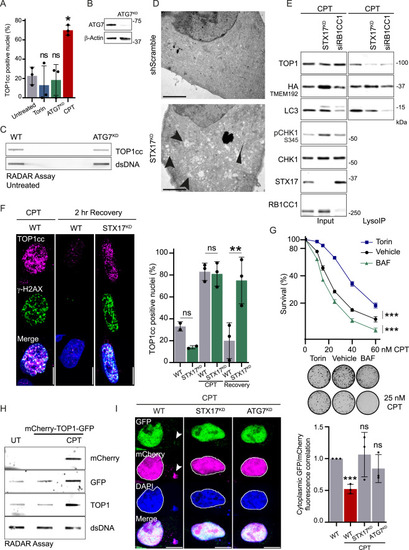
Autophagy regulates TOP1 degradation to promote DNA damage repair and cell survival, related to Figure 2 (A) Immunofluorescence of TOP1cc foci in WT cells, after induction of shATG7 (ATG7KD), 4 h of treatment with 250 nM Torin, or 2 h of treatment with 50 nM CPT. Quantification of positive nuclei for TOP1cc foci (n = 3). Two-way ANOVA, error bar, SD; comparison against untreated. (B) Immunoblot showing ATG7 depletion in cells used for immunofluorescence and RADAR. (C) RADAR assay to assess TOP1cc level in WT and ATG7KD cells unchallenged (n = 2). Double-stranded (ds) DNA is used as a loading control. (D) Electron microscopy images of HeLa cells transformed with scrambled short hairpin RNA (shRNA; control) and STX17 shRNA. STX17KD presents an accumulation of double-membrane structures, labeled with arrows. (E) LysoIP was performed in HeLa WT or STX17KD, and cells were depleted for RB1CC1 (FIP200) using small interfering RNA (siRNA). Cells were released from a single thymidine block into S-phase and treated with 50 nM CPT and 50 nM BAF for 5 h (n = 3). (F) Immunofluorescence of TOP1cc foci in WT cells or in STX17KD untreated, after 2 h of treatment with 50 nM CPT and after 2 h recovery from CPT treatment. Scale bar, 10 μm. Quantification of positive nuclei for TOP1cc foci (n = 3). Two-way ANOVA. Error bar, SD. (G) Quantification of clonogenic assay of S-phase-synchronized cell treated for 6 h with CPT and either 150 nM Torin-1 or 50 nM BAF (n = 3). Error bar represents mean ± SEM. Two-way ANOVA on the area under the curve. Representative images of untreated or 25 nM CPT colonies obtained by clonogenic assay. (H) RADAR assay to assess the accumulation of TOP1cc when TOP1 is fused to GFP and mCherry after 1 h of 100 nM CPT (n = 2). Double-stranded (ds) DNA is used as a loading control. UT, untransfected untreated condition. (I) Imaging of the reporter mCherry-TOP1-GFP after 3 h of treatment with 50 nM CPT (nM) in WT cells, STX17KD, or ATG7KD (n = 3). Scale bar, 10 μm. Quantification of the correlation between GFP and mCherry fluorescence in the cytoplasm. Two-way ANOVA. Error bar, SD. ∗p < 0.05; ∗∗p < 0.005; ∗∗∗p < 0.0005; ns, not significant. |
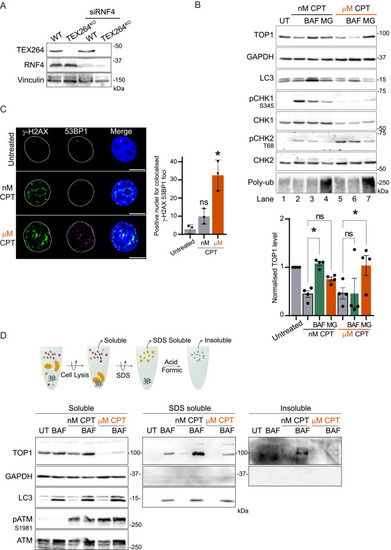
Autophagy promotes TOP1 degradation during replication stress to prevent protein aggregation, related to Figure 3 (A) Immunoblot showing TEX264 and RNF4 depletion in cells used for clonogenic assay. (B) Immunoblot of TOP1 level in total cell extract (n = 4). Treatment with 50 nM CPT was performed for 24 h, and 2 μM MG132 (MG) or 50 nM BAF was added in the last 8 h. Treatment with 1 μM CPT was performed for 3 h with MG132 or BAF. Quantification of normalized TOP1 protein level. One-way ANOVA, SEM represented; UT, untreated. (C) Immunofluorescence of γ-H2AX and 53BP1 foci after 1 h of 50 nM CPT or 1 μM CPT (n = 3). Scale bar, 10 μm. Quantification of positive nuclei for colocalized foci of both γ-H2AX and 53BP1. Two-way ANOVA. Error bar, SD. (D) Method for isolation of aggregated protein by sequential lysis and denaturation step. The aggregates fraction is insoluble in lysis buffer and 1.5% SDS but solubilized in 100% formic acid to be loaded on the gel. Isolation of the aggregates performed after 12 h of treatment with 50 nM CPT or 1 μM CPT (n = 3); UT, untreated. ∗p < 0.05; ns, not significant. |
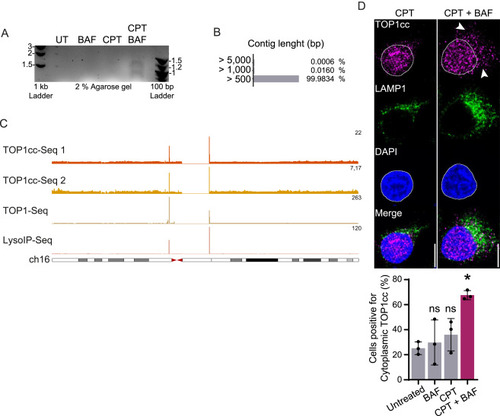
TOP1cc (TOP1 and its bound DNA fragment) are translocated in the cytoplasm and degraded by lysosomes, related to Figure 4 (A) DNA fragments purified by LysoIP after 6 h of treatment with 50 nM CPT and/or 50 nM BAF and run on a 2% agarose gel. UT, untreated. (B) Contigs length distribution was obtained by NGS sequencing of the DNA fragments purified by LysoIP after 6 h of treatment with CPT and 50 nM BAF. (C) Genomic browser images showing ChIP-seq of TOP1cc obtained in MCF7 (1) and LNCAP (2) (GEO: GSE135808),87 ChIP-seq of catalytically engaged TOP1 obtained in HCT116 (GEO: GSE57628),88 and LysoIP-seq signals obtained from sequencing lysosomal DNA after 50 nM CPT in HeLa. ChIP-seq and LysoIP profiles are presented at chromosome 16. All conditions were treated with CPT. Data aligned on genome hg38 and represented as sequence tags per million (TPM). (D) Immunofluorescence of TOP1cc foci and LAMP1 after 4 h of treatment with 50 nM CPT, with or without 50 nM BAF. Quantification of cells positive for cytoplasmic TOP1cc foci (n = 3). Scale bar, 10 μm. Two-way ANOVA. Error bar, SD. ∗p < 0.05; ns, not significant. |

CPT induces nuclear envelope blistering and TOP1cc exit to the cytoplasm, related to Figure 5 (A) Representative electron microscopy images for a distinct set of cells. Treatment was conducted for 30 min with 50 nM CPT. Scale bar, 500 nm. Arrows pointing at blister structures. Nu, nucleoplasm; Cy, cytoplasm; A, autophagosome. (B) Representative electron tomographic slices fixed by high-pressure freezing showing nuclear envelope blister in HeLa. Treatment was conducted for 30 min with 50 nM CPT. Scale bar, 2 μm (left); scale bar, 1 μm (zoom, right). Arrows pointing at blister structures. (C) Immunofluorescence of TOP1cc foci and cyclin B1 after 3 h of treatment with 50 nM CPT (n = 3). Cyclin B1 is used as a control for the inhibition of exportin by leptomycin B (LTB). Scale bar, 10 μm. (Left) Quantification of positive cells for cytoplasmic TOP1cc foci. One-way ANOVA. (Right) Cyclin B1 intensity per nuclei (quantification for a representative experiment). t test. Error bar, SD. ∗p < 0.05; ∗∗∗p < 0.0005; ns, not significant. (D) Cryo-focused ion beam (FIB) milling and cryo-fluorescence correlation images of cells after 30 min of 50 nM CPT treatment. Lysosomes are stained with LysoTracker. (Top) Ion beam image of a final lamellae after targeted milling and correlation between the SEM image of a lamellae, the transmission electron microscopy (TEM) medium magnification montage of the same lamellae acquired at 15,000× (white dashed lines) and the fluorescent molecularly imprinted polymer (MIP) acquired post milling. (Bottom) Close-up view on the TEM medium magnification correlated with LysoTracker fluorescence used for targeted acquisition of the tilt series. Scale bar, 2 μm. |
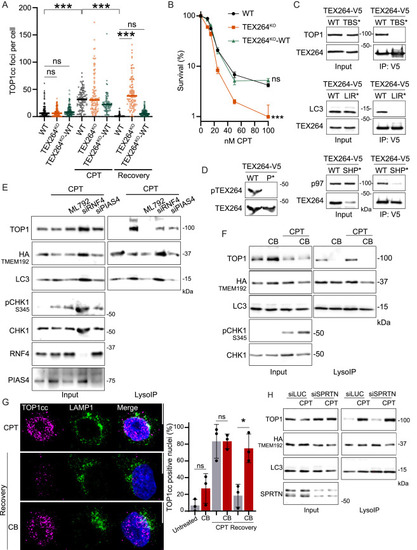
TEX264 with p97 and SUMO acts as the receptor for TOP1cc degradation by autophagy, related to Figure 6 (A) Immunofluorescence of TOP1cc foci in WT cells, TEX264KO, or TEX264KO complemented with TEX264WT after 2 h of 50 nM CPT, followed by 2 h of recovery. Quantification TOP1cc foci per nuclei, one experiment shown (n = 3). Two-way ANOVA. Error bar, SD. (B) Quantification of a representative clonogenic assay in WT, TEX264KO or TEX264KO complemented with TEX264WT after 8 h of CPT treatment (n = 3). Error bar represents mean ± SEM. Two-way ANOVA. (C) Co-immunoprecipitation of TEX264-V5 either WT or TBS∗, LIR∗ or SHP∗ mutants to confirm the loss of interaction with respective TEX264-binding partners. (D) Lysate of cells expressing TEX264 WT or P∗ mutant. The antibody used to detect phosphorylation specifically recognizes TEX264 phosphorylated on serines 271 and 272. (E) LysoIP was performed after 5 h of treatment with 50 nM CPT and the inhibitor of SUMO E1 activating enzyme ML792. siRNA targeting RNF4 and PIAS4. All conditions were treated with 50 nM BAF (n = 3). (F) LysoIP performed after 5 h of treatment with 50 nM CPT and 10 μM of p97 inhibitor CB-5083 (CB). All conditions were treated with 50 nM BAF (n = 3). (G) Immunofluorescence of TOP1cc foci after 2 h of 50 nM CPT. Recovery was performed for 2 h in media or with the p97 inhibitor CB-5083 (CB). Scale bar, 10 μm. Quantification of positive nuclei for TOP1cc foci (n = 3). Two-way ANOVA. Error bar, SD. (H) LysoIP performed after 3 h of treatment with 50 nM CPT, depletion of SPRTN achieved using siRNA against SPRTN; control siLUC (n = 3). All conditions were treated with 50 nM BAF. ∗p < 0.05; ∗∗∗p < 0.0005; ns, not significant. |
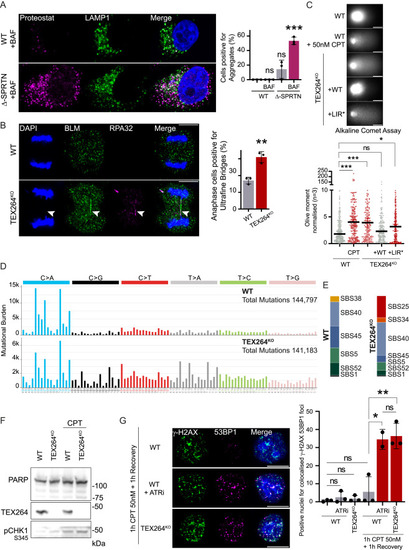
Autophagy of TOP1cc is independent of SPRTN, and TEX264 inactivation promotes genomic instability, related to Figure 7 (A) Immunofluorescence of protein aggregates using the Proteostat dye and the late endosome and lysosome marker LAMP1 after 16 h of treatment with 50 nM CPT in WT or Δ-SPRTN (partial knockout [KO]). Quantification of cells positive for aggregates (n = 3). Scale bar, 10 μm. Two-way ANOVA. Error bar, SD. (B) Anaphase ultrafine bridge detection in cells treated for 2 h with 50 nM CPT and allowed to recover for 24 h (n = 3). Positive BLM and RPA32 anaphase bridges are labeled with arrows. Scale bar, 10 μm. Quantification of anaphase cell presenting ultrafine bridge. t test. Error bar, SD. (C) Alkaline comet assay performed on untreated cells and compared with 50 nM CPT for 1 h treatment (n = 3). WT HeLa cells were compared with TEX264KO cells or indicated TEX264 complementation in TEX264KO background. The quantification of Olive moment normalized against WT untreated; the median is represented. Scale bar, 20 μm. One-way ANOVA. (D) Mutational profiles of WT and TEX264KO comparing untreated to treated cell population assessed by whole-genome sequencing. Treatment was performed with 10 nM CPT for 7 days continuously. Single base substitutions (SBSs) are represented as counts in each trinucleotide context. (E) Proportion of SBS mutational signatures found in the mutational profiles of WT and TEX264KO cells. SigProfilerAssignments used to assign mutations to the nearest SBS mutational signatures present in the COSMIC v.3.3 signature set.145 (F) Immunoblot showing the poly (ADP-ribose) polymerase (PARP) full length as a loading control and to monitor potential apoptotic effect in WT and TEX264KO cells used for whole-genome sequencing after treatment with 10 nM CPT performed for 7 days continuously. (G) Immunofluorescence of γ-H2AX and 53BP1 foci after 1 h of 50 nM CPT and 1 h recovery (n = 4). ATR inhibition was performed using 1 μM ATR inhibitor VE-822 (ATRi) during 1 h with 50 nM CPT and 1 h recovery. Scale bar, 10 μm. Quantification of nuclei positive for colocalized foci of both γ-H2AX and 53BP1. Two-way ANOVA. Error bar, SD. ∗p < 0.05; ∗∗p < 0.005; ∗∗∗p < 0.0005; ns, not significant. |
Reprinted from Cell, 187(20), Lascaux, P., Hoslett, G., Tribble, S., Trugenberger, C., Antičević, I., Otten, C., Torrecilla, I., Koukouravas, S., Zhao, Y., Yang, H., Aljarbou, F., Ruggiano, A., Song, W., Peron, C., Deangeli, G., Domingo, E., Bancroft, J., Carrique, L., Johnson, E., Vendrell, I., Fischer, R., Ng, A.W.T., Ngeow, J., D'Angiolella, V., Raimundo, N., Maughan, T., Popović, M., Milošević, I., Ramadan, K., TEX264 drives selective autophagy of DNA lesions to promote DNA repair and cell survival, 5698-5718.e26, Copyright (2024) with permission from Elsevier. Full text @ Cell