
Fig. S2
- ID
- ZDB-FIG-241016-55
- Publication
- Lascaux et al., 2024 - TEX264 drives selective autophagy of DNA lesions to promote DNA repair and cell survival
- Other Figures
- All Figure Page
- Back to All Figure Page
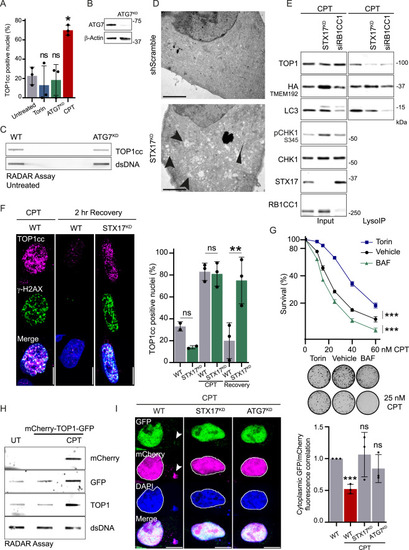
Autophagy regulates TOP1 degradation to promote DNA damage repair and cell survival, related to Figure 2 (A) Immunofluorescence of TOP1cc foci in WT cells, after induction of shATG7 (ATG7KD), 4 h of treatment with 250 nM Torin, or 2 h of treatment with 50 nM CPT. Quantification of positive nuclei for TOP1cc foci (n = 3). Two-way ANOVA, error bar, SD; comparison against untreated. (B) Immunoblot showing ATG7 depletion in cells used for immunofluorescence and RADAR. (C) RADAR assay to assess TOP1cc level in WT and ATG7KD cells unchallenged (n = 2). Double-stranded (ds) DNA is used as a loading control. (D) Electron microscopy images of HeLa cells transformed with scrambled short hairpin RNA (shRNA; control) and STX17 shRNA. STX17KD presents an accumulation of double-membrane structures, labeled with arrows. (E) LysoIP was performed in HeLa WT or STX17KD, and cells were depleted for RB1CC1 (FIP200) using small interfering RNA (siRNA). Cells were released from a single thymidine block into S-phase and treated with 50 nM CPT and 50 nM BAF for 5 h (n = 3). (F) Immunofluorescence of TOP1cc foci in WT cells or in STX17KD untreated, after 2 h of treatment with 50 nM CPT and after 2 h recovery from CPT treatment. Scale bar, 10 μm. Quantification of positive nuclei for TOP1cc foci (n = 3). Two-way ANOVA. Error bar, SD. (G) Quantification of clonogenic assay of S-phase-synchronized cell treated for 6 h with CPT and either 150 nM Torin-1 or 50 nM BAF (n = 3). Error bar represents mean ± SEM. Two-way ANOVA on the area under the curve. Representative images of untreated or 25 nM CPT colonies obtained by clonogenic assay. (H) RADAR assay to assess the accumulation of TOP1cc when TOP1 is fused to GFP and mCherry after 1 h of 100 nM CPT (n = 2). Double-stranded (ds) DNA is used as a loading control. UT, untransfected untreated condition. (I) Imaging of the reporter mCherry-TOP1-GFP after 3 h of treatment with 50 nM CPT (nM) in WT cells, STX17KD, or ATG7KD (n = 3). Scale bar, 10 μm. Quantification of the correlation between GFP and mCherry fluorescence in the cytoplasm. Two-way ANOVA. Error bar, SD. ∗p < 0.05; ∗∗p < 0.005; ∗∗∗p < 0.0005; ns, not significant. |
Reprinted from Cell, 187(20), Lascaux, P., Hoslett, G., Tribble, S., Trugenberger, C., Antičević, I., Otten, C., Torrecilla, I., Koukouravas, S., Zhao, Y., Yang, H., Aljarbou, F., Ruggiano, A., Song, W., Peron, C., Deangeli, G., Domingo, E., Bancroft, J., Carrique, L., Johnson, E., Vendrell, I., Fischer, R., Ng, A.W.T., Ngeow, J., D'Angiolella, V., Raimundo, N., Maughan, T., Popović, M., Milošević, I., Ramadan, K., TEX264 drives selective autophagy of DNA lesions to promote DNA repair and cell survival, 5698-5718.e26, Copyright (2024) with permission from Elsevier. Full text @ Cell