
|
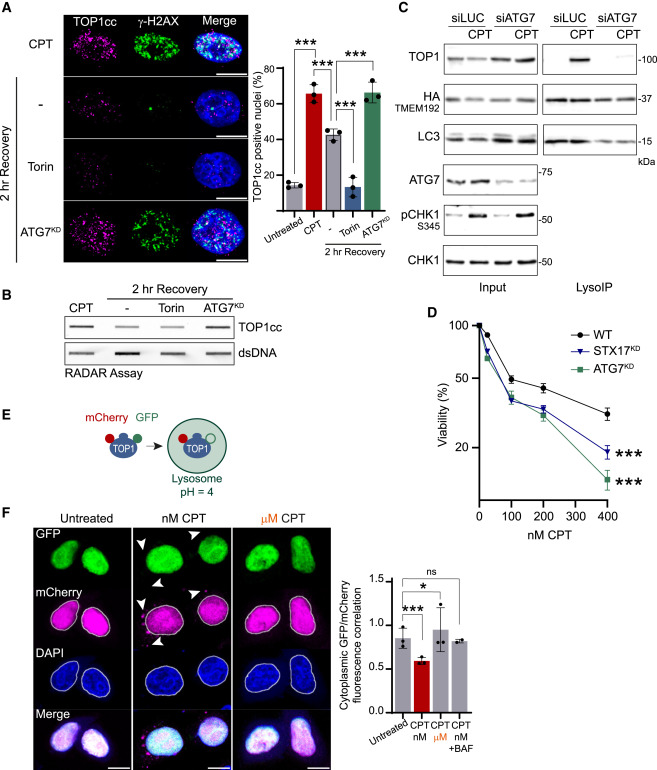
Fig. 2 Autophagy repairs TOP1cc to promote cell survival to CPT (A) Immunofluorescence after 2 h of 50 nM CPT. Torin, 250 nM Torin-1. Quantification of positive nuclei for TOP1cc foci (n = 3). Two-way ANOVA. Error bar, SD. (B) RADAR assay after 2 h of 50 nM CPT (n = 2). Torin, 250 nM Torin-1. Double-stranded (ds) DNA; loading control. (C) LysoIP performed after 6 h of 50 nM CPT (n = 3). (D) Cell viability after 48 h of CPT (n = 4). Error bar, SEM. (E) Strategy used to follow TOP1 delivery to lysosomes. The reporter mCherry-TOP1-GFP presents red and green fluorescence except if internalized in lysosomes (pH = 4). (F) Imaging of mCherry-TOP1-GFP after 3 h of 50 nM CPT (nM) or 1 μM CPT (μM) (n = 3). Bafilomycin A1 (BAF), negative control. Quantification of the correlation between GFP and mCherry fluorescence in the cytoplasm. Two-way ANOVA. Error bar, SD. Scale bar, 10 μm. ∗p < 0.05; ∗∗∗p < 0.0005; ns, not significant. See also Figure S2.
Reprinted from Cell, 187(20), Lascaux, P., Hoslett, G., Tribble, S., Trugenberger, C., Antičević, I., Otten, C., Torrecilla, I., Koukouravas, S., Zhao, Y., Yang, H., Aljarbou, F., Ruggiano, A., Song, W., Peron, C., Deangeli, G., Domingo, E., Bancroft, J., Carrique, L., Johnson, E., Vendrell, I., Fischer, R., Ng, A.W.T., Ngeow, J., D'Angiolella, V., Raimundo, N., Maughan, T., Popović, M., Milošević, I., Ramadan, K., TEX264 drives selective autophagy of DNA lesions to promote DNA repair and cell survival, 5698-5718.e26, Copyright (2024) with permission from Elsevier. Full text @ Cell