
Fig. S7
- ID
- ZDB-FIG-241016-64
- Publication
- Lascaux et al., 2024 - TEX264 drives selective autophagy of DNA lesions to promote DNA repair and cell survival
- Other Figures
- All Figure Page
- Back to All Figure Page
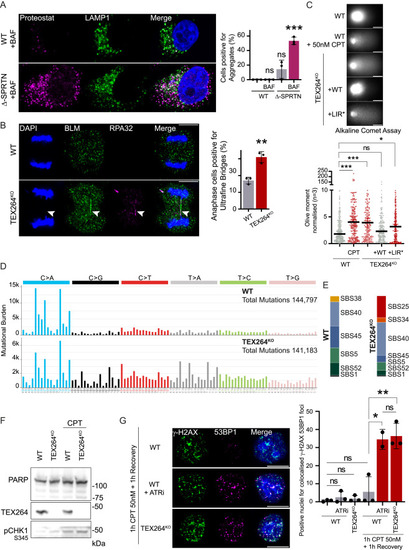
Autophagy of TOP1cc is independent of SPRTN, and TEX264 inactivation promotes genomic instability, related to Figure 7 (A) Immunofluorescence of protein aggregates using the Proteostat dye and the late endosome and lysosome marker LAMP1 after 16 h of treatment with 50 nM CPT in WT or Δ-SPRTN (partial knockout [KO]). Quantification of cells positive for aggregates (n = 3). Scale bar, 10 μm. Two-way ANOVA. Error bar, SD. (B) Anaphase ultrafine bridge detection in cells treated for 2 h with 50 nM CPT and allowed to recover for 24 h (n = 3). Positive BLM and RPA32 anaphase bridges are labeled with arrows. Scale bar, 10 μm. Quantification of anaphase cell presenting ultrafine bridge. t test. Error bar, SD. (C) Alkaline comet assay performed on untreated cells and compared with 50 nM CPT for 1 h treatment (n = 3). WT HeLa cells were compared with TEX264KO cells or indicated TEX264 complementation in TEX264KO background. The quantification of Olive moment normalized against WT untreated; the median is represented. Scale bar, 20 μm. One-way ANOVA. (D) Mutational profiles of WT and TEX264KO comparing untreated to treated cell population assessed by whole-genome sequencing. Treatment was performed with 10 nM CPT for 7 days continuously. Single base substitutions (SBSs) are represented as counts in each trinucleotide context. (E) Proportion of SBS mutational signatures found in the mutational profiles of WT and TEX264KO cells. SigProfilerAssignments used to assign mutations to the nearest SBS mutational signatures present in the COSMIC v.3.3 signature set.145 (F) Immunoblot showing the poly (ADP-ribose) polymerase (PARP) full length as a loading control and to monitor potential apoptotic effect in WT and TEX264KO cells used for whole-genome sequencing after treatment with 10 nM CPT performed for 7 days continuously. (G) Immunofluorescence of γ-H2AX and 53BP1 foci after 1 h of 50 nM CPT and 1 h recovery (n = 4). ATR inhibition was performed using 1 μM ATR inhibitor VE-822 (ATRi) during 1 h with 50 nM CPT and 1 h recovery. Scale bar, 10 μm. Quantification of nuclei positive for colocalized foci of both γ-H2AX and 53BP1. Two-way ANOVA. Error bar, SD. ∗p < 0.05; ∗∗p < 0.005; ∗∗∗p < 0.0005; ns, not significant. |
Reprinted from Cell, 187(20), Lascaux, P., Hoslett, G., Tribble, S., Trugenberger, C., Antičević, I., Otten, C., Torrecilla, I., Koukouravas, S., Zhao, Y., Yang, H., Aljarbou, F., Ruggiano, A., Song, W., Peron, C., Deangeli, G., Domingo, E., Bancroft, J., Carrique, L., Johnson, E., Vendrell, I., Fischer, R., Ng, A.W.T., Ngeow, J., D'Angiolella, V., Raimundo, N., Maughan, T., Popović, M., Milošević, I., Ramadan, K., TEX264 drives selective autophagy of DNA lesions to promote DNA repair and cell survival, 5698-5718.e26, Copyright (2024) with permission from Elsevier. Full text @ Cell