fli1b mutants display reduced primitive and definitive hematopoiesis. (A-F) Whole-mount in situ hybridization (WISH) analysis of expression of the erythroid markers gata1 (A,B) and hbbe3 (C,D) and the hematopoietic marker scl (E,F) in fli1b−/− mutant and wild-type (wt) embryos (in fli1a:GFP background) at 22 h post fertilization (hpf). fli1a:GFP embryos were used as controls to enable fluorescence analysis of any potential defects in vascular development in fli1b−/− embryos, which show GFP expression linked to fli1b mutation. Note greatly reduced expression of gata1 and hbbe3 and moderately reduced expression of scl in the intermediate cell mass region (arrows) in fli1b mutants. (G-J) qPCR analysis of gata1 (G), hbbe3 (H), scl (I) and fli1b (J) expression in fli1b−/− mutant and wt fli1a:GFP embryos at the 20-somite stage. Note the significant reduction in gata1, hbbe3 and fli1b expression in fli1b mutant embryos. Bars show mean±s.d. ns, not significant; *P<0.05; **P<0.01; ***P<0.001; Student's two-tailed unpaired t-test. (K-N) Heme staining using o-dianisidine in fli1b mutant and control wt fli1a:GFP embryos at 2 and 3 days post fertilization (dpf). Note greatly reduced staining (arrows) in fli1b mutant embryos. (O,P) Quantification of embryos with normal and reduced heme staining at 2 dpf (O) and 3 dpf (P). ****P<0.0001; Fisher's exact test. (Q-T) WISH analysis for expression of the hematopoietic stem cell and progenitor markers runx1 and cmyb at 28 hpf in the trunk region of fli1b mutant and control wt fli1a:GFP embryos. Note the greatly reduced or absent staining (arrows) in fli1b mutants. All experiments have been replicated at least twice.

Analysis of fli1b expression in vasculature and red blood cells. (A-F) Expression analysis of fli1b, the erythroid marker gata1 and the vascular endothelial marker kdrl:GFP at 15-somite (som) and 22-hpf stages. Fluorescence in situ hybridization (FISH) for fli1b (magenta) and gata1 (red) was performed using hybridization chain reaction (HCR) on kdrl:GFP zebrafish embryos. Note gata1 expression in red blood cells (RBCs; white arrows, A,B), and fli1b and kdrl:GFP co-expression in vascular endothelial cells at the 15-somite stage (yellow arrowheads, A,C), and in the dorsal aorta (DA) and posterior cardinal vein (PCV) at 22 hpf (D-F). Early vascular endothelial progenitor cells (white arrowheads, A,B), as well as late-forming vascular progenitors (white arrowheads, D,E) were positive for fli1b expression but negative for kdrl:GFP. Note that RBCs were largely negative for fli1b expression. (G-L) Live imaging of fluorescent fli1b+/−; scl:dsRed or kdrl:mCherry embryos at 22 hpf. Due to the gene-trap construct insertion into the fli1b locus, GFP fluorescence is indicative of fli1b expression. Note the absence of fli1b expression (green) in the RBCs, positive for scl:dsRed, whereas it overlaps with vascular endothelial kdrl:mCherry expression. Also note that scl:dsRed expression labels both vascular endothelial cells (positive for fli1b) and erythrocytes (negative for fli1b). Images represent ten embryos (A-C), nine embryos (D-I) and six embryos (J-L).

fli1b functions upstream of scl in hematopoietic progenitors. (A-D) scl expression analysis using hybridization chain reaction (HCR) in the trunk region of fli1b+/− and fli1b−/− embryos at the 15-somite stage. Bilaterally located hematopoietic progenitors in fli1b+/− embryos show high scl and no GFP expression (scl+ GFP, red arrows, A), whereas vascular endothelial progenitors, which are either at the midline or in the process of migration, show high GFP and low scl (scllow GFP+, white arrow, A). In fli1b−/− embryos, the number of hematopoietic scl+ GFP cells is reduced (red arrows, B-D), whereas the number of double-positive scl+ GFP+ cells is increased. Many double-positive cells are located bilaterally (white arrows, B-D), where hematopoietic cells are positioned in the control fli1b+/− embryos, suggesting that some hematopoietic cells have a mixed identity in fli1b−/− embryos. (E-H) Quantification of cell number and scl fluorescence intensity in the trunk and tail region of fli1b+/− and fli1b−/− embryos at the 15-somite stage. Note the increased scl+ GFP+ cell number and higher scl fluorescence intensity of in fli1b−/− embryos, possibly due to increased fli1b and GFP expression in hematopoietic cells, which are GFP negative in control fli1b+/− embryos. scl+ GFP hematopoietic cell number and scl expression are reduced in fli1b−/− mutants, indicative of reduced erythroid cell differentiation. *P<0.05; **P<0.01; ***P<0.001; ****P<0.0001; Student's two-tailed unpaired t-test. (I-K) HCR analysis for erythroid gata1 (arrows) and vascular endothelial fli1b (arrowheads) expression, which is reduced in the trunk region of scl MO-injected embryos compared to that in uninjected controls at the 22 hpf stage. *P<0.05; Student's two-tailed unpaired t-test. (L-T) scl mRNA rescues gata1 expression in fli1b mutant embryos at 22 hpf stage. (L) Quantification of gata1 fluorescence in the trunk region. *P<0.05; ****P<0.0001, Student's two-tailed unpaired t-test. HCR analysis of gata1 expression in control uninjected or scl mRNA-injected wt fli1a:GFP (M-P) or fli1b−/− (Q-T) embryos. Note expansion of fli1a:GFP (arrowhead) and gata1 expression (arrows) in wt embryos injected with scl mRNA (O,P). Uninjected fli1b−/− embryos showed reduced gata1 expression (arrows, R), which was expanded in scl mRNA-injected embryos (arrows, T). Similar regions of the embryonic mid-trunk are shown in M-T. Bars in E-H,K,L show mean±s.d.

Myeloid marker expression analysis at 24 hpf. HCR analysis for expression of the pan-myeloid marker lcp1 (A-C), the neutrophil marker lyz (D-F) and the macrophage marker mpeg1.1 (G-I) in fli1b+/− control and fli1b−/− mutant embryos. Two populations of lcp1+ GFP+ (or lyz+ GFP+ or mpeg1.1+ GFP+) and lcp1+ GFP (or lyz+ GFP or mpeg1.1+ GFP) were observed. Boxed areas are shown at a higher magnification in the upper right inserts. White arrowheads show GFP+ myeloid cells, whereas yellow arrowheads show GFP myeloid cells. Only myeloid cells located at the yolk surface were quantified. Note that the number of GFP+ myeloid cells was significantly increased in fli1b−/− embryos, whereas the number of GFP myeloid cells was reduced. Myeloid cell GFP expression was faint in fli1b+/− embryos and much brighter in fli1b−/− embryos; both weak and strong GFP+ cells were included in GFP cell counts. Bars show mean±s.d. ****P<0.0001; Student's two-tailed unpaired t-test.

Increased endocardial-derived myelopoiesis in fli1b mutant embryos. (A-E) Hybridization chain reaction (HCR) analysis for the myeloid marker spi1b (red) expression in the anterior region of fli1b+/− and fli1b−/− embryos at the 15-somite stage. Merged green and red (A,C) and red-only (B,D) channels are shown; embryos were deyolked and flat mounted. Note that many myeloid progenitors are present at the midline (arrows) at this stage and do not overlap with endothelial/endocardial GFP reporter expression (some apparent overlap is an artifact of the maximum-intensity projection). spi1b expression was greatly reduced in fli1b−/− embryos. Some remaining autofluorescent yolk granules (dim red fluorescence) are visible in the images. The number of spi1b+ cells is quantified in E. ns, not significant; *P<0.05; Student's two-tailed unpaired t-test. (F-H) HCR analysis for spi1b expression (red) at the surface of the yolk in fli1b+/− and fli1b−/− embryos at the 24 hpf stage. Note that both single-positive spi1b+ GFP cells (white arrows) and double-positive spi1b+ GFP+ cells (yellow arrows) are apparent in fli1b+/− embryos. The number of double-positive cells was greatly increased, whereas the number of single-positive spi1b+ GFP cells was reduced in fli1b−/− embryos, which were quantified in H. Insets in the upper right show magnified views of yolk regions in F,G. ****P<0.0001; Student's two-tailed unpaired t-test. (I-K) HCR analysis for spi1b expression in flat-mounted preparations of the endocardium of fli1b+/− and fli1b−/− embryos at 24 hpf. The number of spi1b+ cells located within the endocardium (yellow arrows) was greatly increased in fli1b−/− embryos. The inset in J shows a magnified portion of the endocardium. ns, not significant; ****P<0.0001; Student's two-tailed unpaired t-test. Bars show mean±s.d.

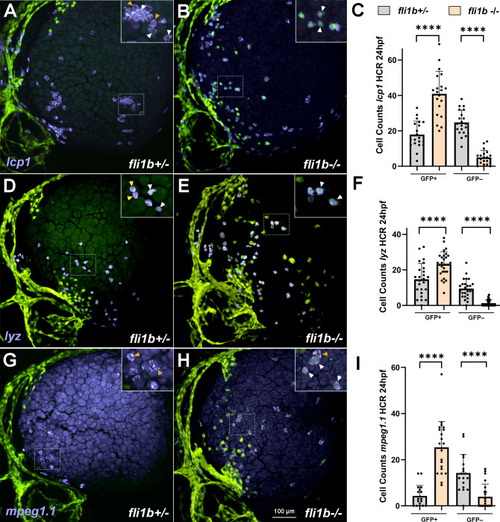
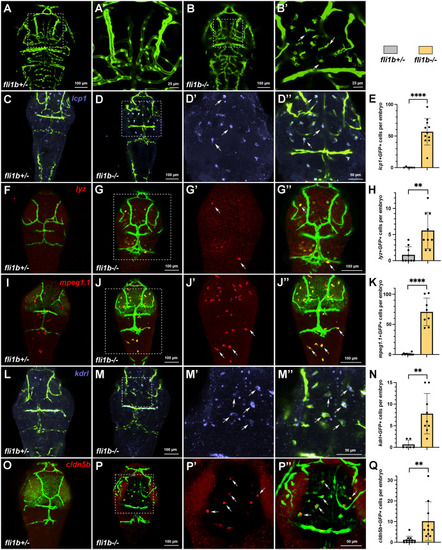
Myeloid cells express vascular endothelial markers in fli1b−/− embryos. (A-B′) Confocal imaging of the head region (dorsal view) of live fli1b+/− and fli1b−/− zebrafish embryos at 3 dpf. A′,B′ show higher-magnification images of A,B. Note that multiple microglia-like cells (arrows, B′) are apparent in fli1b−/− but not in fli1b+/− embryos. (C-K) HCR analysis of expression of the myeloid marker lcp1 (blue, C-D″), the neutrophil marker lyz (red, F-G″) and the macrophage marker mpeg1.1 (red, I-J″) in fli1b+/− and fli1b−/− embryos. D′,D″, G′,G″ and J′,J″ show higher-magnification views of individual and merged channels of fli1b−/− embryos in D, G and J, respectively. Arrows in Dʹ,D″,Gʹ,G″,Jʹ,J″ indicate microglia-like cells that co-express lcp1, lyz or mpeg1.1. (E,H,K) Quantification of GFP-positive cells that co-express lcp1, lyz or mpeg1.1, respectively, in the selected area of the head region of fli1b+/− and fli1b−/− embryos. (L-Q) HCR analysis of expression of the vascular endothelial marker kdrl and cldn5b in fli1b+/− and fli1b−/− embryos at 3 dpf. M′,M″,P′,P″ show higher-magnification views of M,P in fli1b mutant embryos. Arrows in Mʹ,M″,Pʹ,P″ indicate microglia-like cells that co-express kdrl and cldn5b. (N,Q) Quantification of GFP-positive cells that co-express kdrl or cldn5b in the selected areas of the head region of fli1b+/− and fli1b−/− embryos. Bars show mean±s.d. **P<0.01; ****P<0.0001; Student's two-tailed unpaired t-test.

Single-cell RNA-seq analysis of fli1b mutant and wt embryos at 23-24 hpf. (A) Uniform manifold approximation and projection (UMAP) plot showing aggregated cell clusters from wt and fli1b mutant embryos, obtained by the corresponding in-crosses of sibling parents. Vascular endothelial cell (EC), red blood cell (RBC) and myeloid cell populations were identified based on marker expression (red dotted circles). (B) Feature plots for the RBC marker gata1a, the EC marker cdh5 and the myeloid marker spi1b in RBCs, endothelial and myeloid clusters, respectively, of wt and fli1b mutant embryos. (C,D) Violin plots of fli1b (C) and scl (D) expression in EC, RBC and myeloid populations. (E) Violin plots of kdrl expression in ECs, gata1a and hbae3 expression in RBCs, and spi1b, kdrl and cdh5 expression in myeloid populations. Note that gata1a and hbae3 expression was reduced in fli1b−/− embryos, whereas kdrl and spi1b expression showed no significant change. kdrl and cdh5 expression is apparent in a subset of myeloid cells in fli1b mutants but not in wt embryos.

A proposed model for the role of fli1b during the emergence of hematopoietic lineages. (A) fli1b is expressed in the common precursor of vascular endothelial cells and erythrocytes, the hemangioblast, where it upregulates scl expression. After the angioblast and erythroid lineages separate, fli1b is maintained only in angioblast/vascular endothelial progenitor cells, where it promotes endothelial differentiation together with etv2, whereas scl promotes the erythroid differentiation program. (B) The role of fli1b in myeloid differentiation. fli1b is required for spi1b expression in the earliest myeloid progenitors, which emerge from the anterior lateral plate mesoderm (ALPM) prior to the 15-somite stage. At approximately 24 hpf, the second wave of myeloid cells emerges from the endocardium. Endocardial-derived myelopoiesis is increased in fli1b mutants.

Acknowledgments
This image is the copyrighted work of the attributed author or publisher, and ZFIN has permission only to display this image to its users. Additional permissions should be obtained from the applicable author or publisher of the image. Full text @ Biol. Open