IMAGE

Fig. 7.

ID
ZDB-IMAGE-250422-92
Source
Figures for Laverde et al., 2025
Image
Figure Caption

Fig. 7.

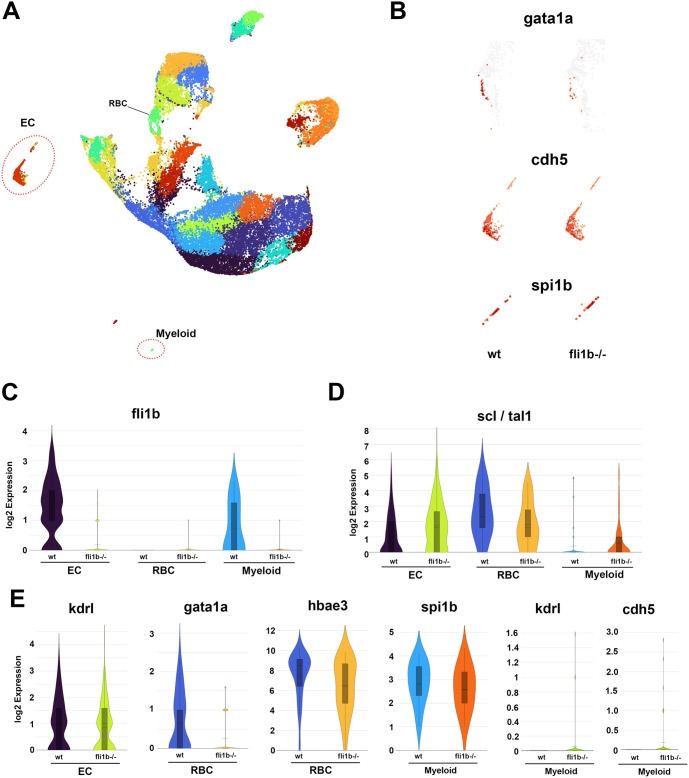
Single-cell RNA-seq analysis of fli1b mutant and wt embryos at 23-24 hpf. (A) Uniform manifold approximation and projection (UMAP) plot showing aggregated cell clusters from wt and fli1b mutant embryos, obtained by the corresponding in-crosses of sibling parents. Vascular endothelial cell (EC), red blood cell (RBC) and myeloid cell populations were identified based on marker expression (red dotted circles). (B) Feature plots for the RBC marker gata1a, the EC marker cdh5 and the myeloid marker spi1b in RBCs, endothelial and myeloid clusters, respectively, of wt and fli1b mutant embryos. (C,D) Violin plots of fli1b (C) and scl (D) expression in EC, RBC and myeloid populations. (E) Violin plots of kdrl expression in ECs, gata1a and hbae3 expression in RBCs, and spi1b, kdrl and cdh5 expression in myeloid populations. Note that gata1a and hbae3 expression was reduced in fli1b−/− embryos, whereas kdrl and spi1b expression showed no significant change. kdrl and cdh5 expression is apparent in a subset of myeloid cells in fli1b mutants but not in wt embryos.

Acknowledgments
This image is the copyrighted work of the attributed author or publisher, and ZFIN has permission only to display this image to its users. Additional permissions should be obtained from the applicable author or publisher of the image. Full text @ Biol. Open