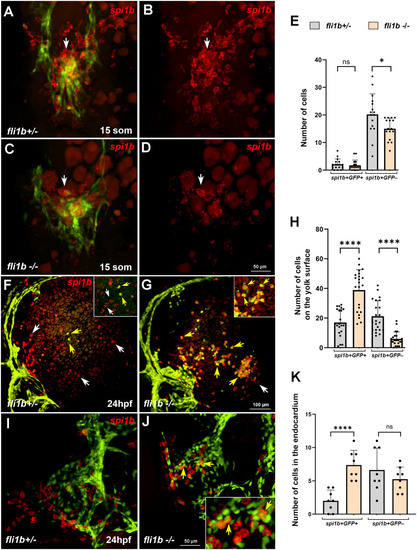
Increased endocardial-derived myelopoiesis in fli1b mutant embryos. (A-E) Hybridization chain reaction (HCR) analysis for the myeloid marker spi1b (red) expression in the anterior region of fli1b+/− and fli1b−/− embryos at the 15-somite stage. Merged green and red (A,C) and red-only (B,D) channels are shown; embryos were deyolked and flat mounted. Note that many myeloid progenitors are present at the midline (arrows) at this stage and do not overlap with endothelial/endocardial GFP reporter expression (some apparent overlap is an artifact of the maximum-intensity projection). spi1b expression was greatly reduced in fli1b−/− embryos. Some remaining autofluorescent yolk granules (dim red fluorescence) are visible in the images. The number of spi1b+ cells is quantified in E. ns, not significant; *P<0.05; Student's two-tailed unpaired t-test. (F-H) HCR analysis for spi1b expression (red) at the surface of the yolk in fli1b+/− and fli1b−/− embryos at the 24 hpf stage. Note that both single-positive spi1b+ GFP− cells (white arrows) and double-positive spi1b+ GFP+ cells (yellow arrows) are apparent in fli1b+/− embryos. The number of double-positive cells was greatly increased, whereas the number of single-positive spi1b+ GFP− cells was reduced in fli1b−/− embryos, which were quantified in H. Insets in the upper right show magnified views of yolk regions in F,G. ****P<0.0001; Student's two-tailed unpaired t-test. (I-K) HCR analysis for spi1b expression in flat-mounted preparations of the endocardium of fli1b+/− and fli1b−/− embryos at 24 hpf. The number of spi1b+ cells located within the endocardium (yellow arrows) was greatly increased in fli1b−/− embryos. The inset in J shows a magnified portion of the endocardium. ns, not significant; ****P<0.0001; Student's two-tailed unpaired t-test. Bars show mean±s.d.
|
