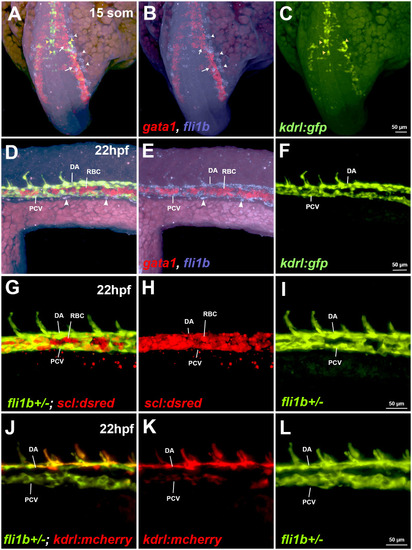
Analysis of fli1b expression in vasculature and red blood cells. (A-F) Expression analysis of fli1b, the erythroid marker gata1 and the vascular endothelial marker kdrl:GFP at 15-somite (som) and 22-hpf stages. Fluorescence in situ hybridization (FISH) for fli1b (magenta) and gata1 (red) was performed using hybridization chain reaction (HCR) on kdrl:GFP zebrafish embryos. Note gata1 expression in red blood cells (RBCs; white arrows, A,B), and fli1b and kdrl:GFP co-expression in vascular endothelial cells at the 15-somite stage (yellow arrowheads, A,C), and in the dorsal aorta (DA) and posterior cardinal vein (PCV) at 22 hpf (D-F). Early vascular endothelial progenitor cells (white arrowheads, A,B), as well as late-forming vascular progenitors (white arrowheads, D,E) were positive for fli1b expression but negative for kdrl:GFP. Note that RBCs were largely negative for fli1b expression. (G-L) Live imaging of fluorescent fli1b+/−; scl:dsRed or kdrl:mCherry embryos at 22 hpf. Due to the gene-trap construct insertion into the fli1b locus, GFP fluorescence is indicative of fli1b expression. Note the absence of fli1b expression (green) in the RBCs, positive for scl:dsRed, whereas it overlaps with vascular endothelial kdrl:mCherry expression. Also note that scl:dsRed expression labels both vascular endothelial cells (positive for fli1b) and erythrocytes (negative for fli1b). Images represent ten embryos (A-C), nine embryos (D-I) and six embryos (J-L).
|
