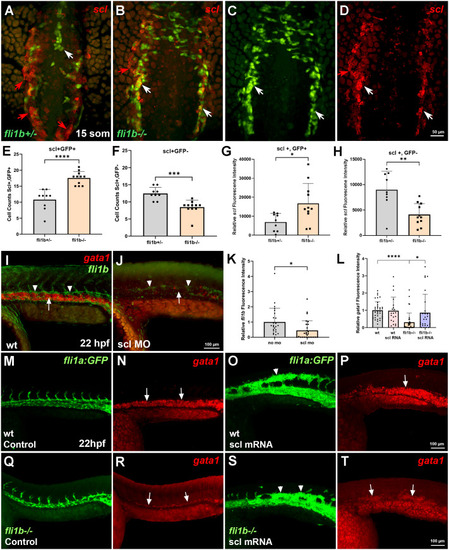
fli1b functions upstream of scl in hematopoietic progenitors. (A-D) scl expression analysis using hybridization chain reaction (HCR) in the trunk region of fli1b+/− and fli1b−/− embryos at the 15-somite stage. Bilaterally located hematopoietic progenitors in fli1b+/− embryos show high scl and no GFP expression (scl+ GFP−, red arrows, A), whereas vascular endothelial progenitors, which are either at the midline or in the process of migration, show high GFP and low scl (scllow GFP+, white arrow, A). In fli1b−/− embryos, the number of hematopoietic scl+ GFP− cells is reduced (red arrows, B-D), whereas the number of double-positive scl+ GFP+ cells is increased. Many double-positive cells are located bilaterally (white arrows, B-D), where hematopoietic cells are positioned in the control fli1b+/− embryos, suggesting that some hematopoietic cells have a mixed identity in fli1b−/− embryos. (E-H) Quantification of cell number and scl fluorescence intensity in the trunk and tail region of fli1b+/− and fli1b−/− embryos at the 15-somite stage. Note the increased scl+ GFP+ cell number and higher scl fluorescence intensity of in fli1b−/− embryos, possibly due to increased fli1b and GFP expression in hematopoietic cells, which are GFP negative in control fli1b+/− embryos. scl+ GFP– hematopoietic cell number and scl expression are reduced in fli1b−/− mutants, indicative of reduced erythroid cell differentiation. *P<0.05; **P<0.01; ***P<0.001; ****P<0.0001; Student's two-tailed unpaired t-test. (I-K) HCR analysis for erythroid gata1 (arrows) and vascular endothelial fli1b (arrowheads) expression, which is reduced in the trunk region of scl MO-injected embryos compared to that in uninjected controls at the 22 hpf stage. *P<0.05; Student's two-tailed unpaired t-test. (L-T) scl mRNA rescues gata1 expression in fli1b mutant embryos at 22 hpf stage. (L) Quantification of gata1 fluorescence in the trunk region. *P<0.05; ****P<0.0001, Student's two-tailed unpaired t-test. HCR analysis of gata1 expression in control uninjected or scl mRNA-injected wt fli1a:GFP (M-P) or fli1b−/− (Q-T) embryos. Note expansion of fli1a:GFP (arrowhead) and gata1 expression (arrows) in wt embryos injected with scl mRNA (O,P). Uninjected fli1b−/− embryos showed reduced gata1 expression (arrows, R), which was expanded in scl mRNA-injected embryos (arrows, T). Similar regions of the embryonic mid-trunk are shown in M-T. Bars in E-H,K,L show mean±s.d.
|
