|
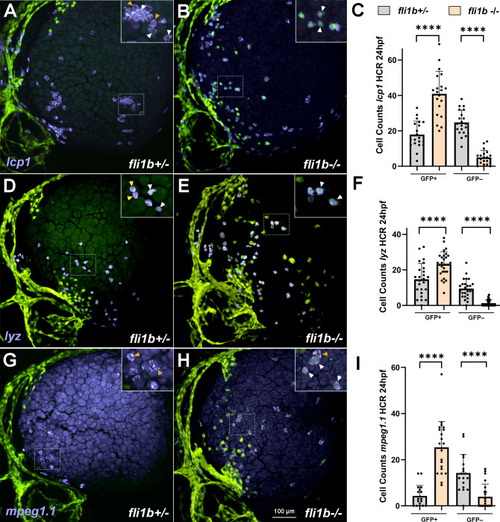
Myeloid marker expression analysis at 24 hpf. HCR analysis for expression of the pan-myeloid marker lcp1 (A-C), the neutrophil marker lyz (D-F) and the macrophage marker mpeg1.1 (G-I) in fli1b+/− control and fli1b−/− mutant embryos. Two populations of lcp1+ GFP+ (or lyz+ GFP+ or mpeg1.1+ GFP+) and lcp1+ GFP− (or lyz+ GFP− or mpeg1.1+ GFP−) were observed. Boxed areas are shown at a higher magnification in the upper right inserts. White arrowheads show GFP+ myeloid cells, whereas yellow arrowheads show GFP− myeloid cells. Only myeloid cells located at the yolk surface were quantified. Note that the number of GFP+ myeloid cells was significantly increased in fli1b−/− embryos, whereas the number of GFP− myeloid cells was reduced. Myeloid cell GFP expression was faint in fli1b+/− embryos and much brighter in fli1b−/− embryos; both weak and strong GFP+ cells were included in GFP cell counts. Bars show mean±s.d. ****P<0.0001; Student's two-tailed unpaired t-test.
|