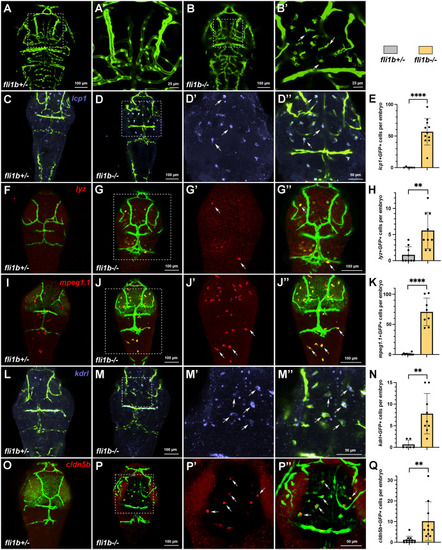
Myeloid cells express vascular endothelial markers in fli1b−/− embryos. (A-B′) Confocal imaging of the head region (dorsal view) of live fli1b+/− and fli1b−/− zebrafish embryos at 3 dpf. A′,B′ show higher-magnification images of A,B. Note that multiple microglia-like cells (arrows, B′) are apparent in fli1b−/− but not in fli1b+/− embryos. (C-K) HCR analysis of expression of the myeloid marker lcp1 (blue, C-D″), the neutrophil marker lyz (red, F-G″) and the macrophage marker mpeg1.1 (red, I-J″) in fli1b+/− and fli1b−/− embryos. D′,D″, G′,G″ and J′,J″ show higher-magnification views of individual and merged channels of fli1b−/− embryos in D, G and J, respectively. Arrows in Dʹ,D″,Gʹ,G″,Jʹ,J″ indicate microglia-like cells that co-express lcp1, lyz or mpeg1.1. (E,H,K) Quantification of GFP-positive cells that co-express lcp1, lyz or mpeg1.1, respectively, in the selected area of the head region of fli1b+/− and fli1b−/− embryos. (L-Q) HCR analysis of expression of the vascular endothelial marker kdrl and cldn5b in fli1b+/− and fli1b−/− embryos at 3 dpf. M′,M″,P′,P″ show higher-magnification views of M,P in fli1b mutant embryos. Arrows in Mʹ,M″,Pʹ,P″ indicate microglia-like cells that co-express kdrl and cldn5b. (N,Q) Quantification of GFP-positive cells that co-express kdrl or cldn5b in the selected areas of the head region of fli1b+/− and fli1b−/− embryos. Bars show mean±s.d. **P<0.01; ****P<0.0001; Student's two-tailed unpaired t-test.
|