
- Title
-
Gonacin: A germ cell-derived hormone with glucogenic, orexigenic, and gonadal activities
- Authors
- Hu, Y., Zhao, S., Liu, Z., Kang, T., Hsueh, A.J.W., Li, J.
- Source
- Full text @ iScience
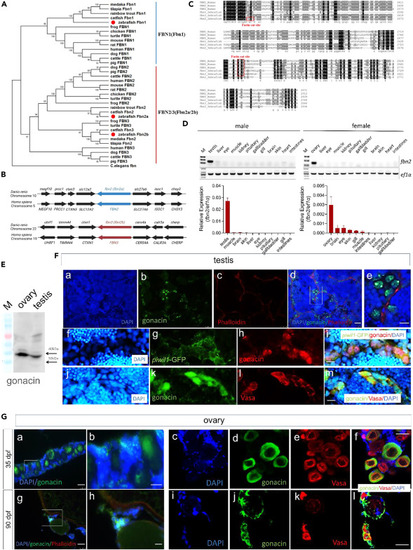
Phylogenic comparison of FBN genes and identification of gonacin in zebrafish gonads (A) Phylogenic tracing of three FBN genes in diverse vertebrates showing three zebrafish paralogs (red dots). (B) Syntenic regions of FBN2 and FBN3 genes in human and zebrafish chromosomes. (C) Discovery of a consensus furin cleavage site upstream of placensin-like sequences in zebrafish Fbn2. Furin cleavage sites were marked by red boxes. The meaning of the number on the right side is the number of amino acids from the translation starting site. (D) Expression of fbn2 transcripts was mainly detected in the gonad tissues of in adult zebrafish as detected by RT-PCR and electrophoresis (upper panel) as well as real-time qPCR (lower panel) in different tissues of adult zebrafish. (E) Expression of gonacin protein was detected by Western blotting in zebrafish ovary and testis. Tissue extracts were subjected to immunoblotting using gonacin antibodies. M: marker protein. (F) Expression of gonacin protein was detected by fluorescence immunostaining in the testis of adult zebrafish. Signals for DAPI (a), gonacin (b), phalloidin (c), and all three (d). (e) shows the signal of the box area indicated in (d). Signals for DAPI (f), GFP driven by the piwi promoter (g), gonacin (h), and all three (i). Signals for DPI (j), gonacin (k), Vasa (L), and all three (n). gonacin (green) and Vasa (red) are localized in germ cells. (g) The co-localization of gonacin (red) and GFP driven by the piwi promoter (green) in spermatogonia cells. DAPI (blue) was used as a nuclear counterstaining and phalloidin (red) was used as an F-actin counterstaining. Scale bar: 25 μm (a, b, c, and d), 10 μm (e, f, g, h, i, j, k, l, m, and n). (G) Expression of gonacin protein was detected by fluorescence immunostaining in zebrafish ovary. Expression of gonacin in the ovary of zebrafish at 35 dpf (a, b, c, d, e, and f) and 90 dpf (g, h, i, j, k, and l). (b) and (h) show amplified areas in (a) and (g), respectively. Signals for gonacin (green, d and j) and Vasa (red, e and k) were in germ cells. DAPI (blue) was used as a nuclear counterstaining (c and i) and all three (f and l). Scale bar: 25 μm (a and g), 20 μm (c, d, e, f, i, j, k, and l), 10 μm (b and h). |
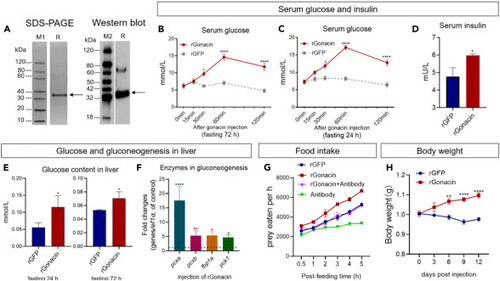
Glucogenic and orexigenic activities of gonacin in zebrafish (A) Characterization of recombinant zebrafish gonacin protein (rGonacin). Coomassie blue staining (left panel) and immunoblotting (right panel) of bacteria-derived recombinant gonacin. M1, M2: marker proteins, R: rGonacin. (B and C) Serum glucose was measured at indicated times after a single 4 μg dose of intraperitoneal injection of rGonacin or recombinant GFP protein (rGFP, using as the control) into zebrafish that had been subjected to a 72 h fast (B) and 24 h fast (C) before injection. ∗, p < 0.05; ∗∗∗∗, p < 0.0001, compared with control (n = 8 in each group). two-way ANOVA with Bonferroni post-test was used to calculate the p value. (D) Serum insulin levels were measured at 1 h after a single dose of intraperitoneal injection of rGonacin (4 μg) or rGFP in zebrafish (n = 3 in each group). ∗, p < 0.05; Unpaired Student’s t test was used to calculate the p value. (E) Liver glucose content was measured by ELISA at 1 h after a single intraperitoneal injection of rGonacin (4 μg) or rGFP (control) into zebrafish that had been subjected to a 72 h fast (left panel) and 24 h fast (right panel) prior to injection (n = 6 in each group). ∗, p < 0.05, compared with control. Unpaired Student’s t test was used to calculate the p value. (F) The expression of glucogenesis enzymes including fbp1a, pck1, pcxa, and pcxb in the liver after a single intraperitoneal injection of rGonacin (4 μg) or rGFP (control) in vivo. The columns represent fold changes of the relative mRNA levels in the treated group over its respective GFP injection controls (mean ± SEM) ∗, p < 0.05; ∗∗, p < 0.01; ∗∗∗, p < 0.001; n = 5. Unpaired Student’s t test was used to calculate the p value. (G) Food intake was measured at indicated times after a single 4 μg dose of intraperitoneal injection of rGonacin (4 μg) or GFP (control), 4 μL anti-gonacin antibodies (Antibody) or 4 μg rGonacin together with 4 μL antibody (rGonacin+Antibody) in zebrafish that had been subjected to an 18 h fast before injection (n = 6 in each group). (H) Body weight was measured at indicated times after 4 times of intraperitoneal injections of recombinant gonacin or GFP (control) at 3 days intervals in zebrafish. ∗∗, p < 0.01; ∗∗∗∗, p < 0.0001. two-way ANOVA with Sidak’s multiple comparisons test was used to calculate the p value |
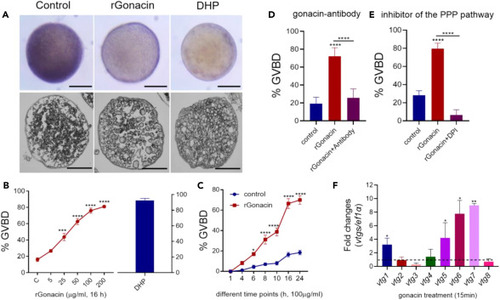
Promotion of oocyte maturation and vitellogenesis by gonacin in zebrafish (A) The morphology (upper panel) and histology (lower panel) of ovarian follicles after treatment with rGonacin (100 μg/mL) for 4 h, using DHP (5 ng/ml) as a positive control. Scale bar: 200 μm. (B) Increased rate of oocyte maturation following treatment with rGonacin at different doses for 16 h. DHP (5 ng/ml) treatment group was used as a positive control. ∗∗∗, p < 0.001; ∗∗∗∗, p < 0.0001, one-way ANOVA followed by Fisher’s least significant difference test was used to calculate the p value. (C) Effects of treatment with rGonacin (100 μg/mL) on the rate of oocyte maturation at indicated time points. ∗, p < 0.05; ∗∗∗∗, p < 0.0001, two-way ANOVA with Sidak’s multiple comparisons test was used to calculate the p value. (D) Effects of treatment with gonacin antibodies for 16 h on the rate of rGonacin-induced oocyte maturation. ∗∗∗∗, p < 0.0001, one-way ANOVA followed by Fisher’s least significant difference test was used to calculate the p value. (E) Blockage of rGonacin-induced oocyte maturation by co-treatment with a PPP inhibitor (DPI) for 16 h. ∗∗∗∗, p < 0.0001, one-way ANOVA followed by Fisher’s least significant difference test was used to calculate the p value. (F) The expression of vtg1-8 in liver after a single intraperitoneal injection of rGonacin (4 μg) or rGFP (control) in vivo. The columns represent fold changes of relative mRNA levels in the treated group over its respective GFP injection controls (mean ± SEM) ∗, p < 0.05; ∗∗, p < 0.01; n = 4. Unpaired Student’s t test was used to calculate the p value. |
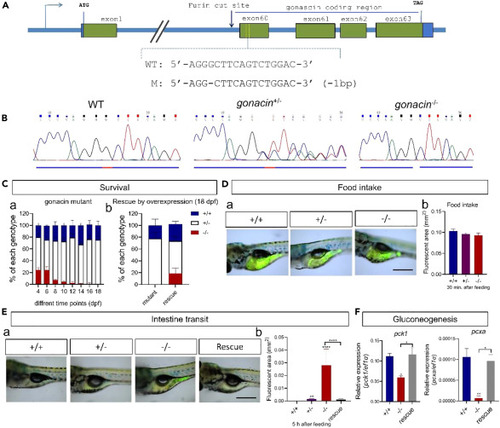
Overexpression of gonacin rescued the larvae lethality phenotype of gonacin null zebrafish (A) Location of the CRISPR/Cas9 binding sites on first exon encoding gonacin of zebrafish to generate gonacin null fish. (B) Sequencing results from the wildtype (WT, gonacin+/+), heterozygous (gonacin+/−), and homozygous (gonacin−/−) zebrafish. (C) Percentages of WT, heterozygous, and homozygous fish during early development from 4 to 18 dpf of zebrafish (n = 20 in each day) (Left panel). Percentages of WT, heterozygous and homozygous fish after overexpression of gonacin in gonacin null zebrafish at 18 dpf (n = 20 in each group) (Right panel). (D) Food intake was assessed by feeding food with luminal tracer in the larvae of WT (+/+) and gonacin mutant fish. a) Individual exhibiting the signal of luminal tracer in the intestine of WT, gonacin heterozygous (+/−) and gonacin homozygous (−/−) fish (7 dpf) after 30 min post feeding. b) Quantitative analysis of luminal tracer signals in the intestine of WT, gonacin+/− and gonacin−/− at 7 dpf at 30 min post-feeding. Scale bar: 0.5 mm. (E) Intestinal transit of food was assessed in zebrafish larvae of WT, gonacin mutants, and gonacin mutants rescued by overexpression of gonacin. a) Individuals exhibiting luminal tracer signals in the intestine of different groups. Rescue: gonacin homozygous rescued by overexpression of gonacin. All zebrafish larvae (7 dpf) were monitored at 5 h after feeding. b) Quantitative analysis of luminal tracer signals in the intestine of different groups. ∗∗, p < 0.01; ∗∗∗∗, p < 0.0001; n = 8. One-way ANOVA followed by Fisher’s least significant difference test was used to calculate the p value. Scale bar: 0.5 mm. (F) The expression of glucogenesis enzymes (pck1 and pcxa) in the liver of WT, gonacin mutants, and gonacin mutants rescued by overexpression of gonacin. ∗, p < 0.05; ∗∗, p < 0.01; n = 5. Unpaired Student’s t test was used to calculate the p value. One-way ANOVA followed by Fisher’s least significant difference test was used to calculate the p value. |
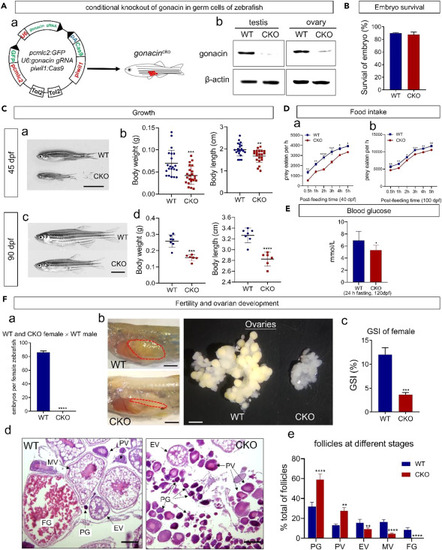
Conditional knockout of gonacin in germ cells led to defects in appetite, serum glucose level, and ovarian development in zebrafish (A) Conditional knockout (CKO) of gonacin in germ cells of zebrafish. a) Construction of a plasmid for targeted knockout of gonacin in germ cells of zebrafish. b) The expression of gonacin was detected in the testis and ovary of wild type (WT) but negligible in CKO at 80 dpf, using β-actin as an internal control. (B) Embryo survival of WT and CKO zebrafish. (C) Assessment of the growth of zebrafish after CKO of gonacin. a) The morphology of WT and CKO zebrafish at 45 dpf. b) Body weight (left panel) and body length (right panel) of WT and CKO zebrafish at 45 dpf. ∗∗, p < 0.01; ∗∗∗, p < 0.001, compared with WT (n = 21). c) The morphology of WT and CKO zebrafish at 90 dpf. d) Body weight (left panel) and body length (right panel) of WT and CKO zebrafish at 90 dpf. ∗∗∗∗, p < 0.0001, compared with WT (n = 7). Scale bar: 0.5 cm. (D) Assessment on the food intake of zebrafish after CKO of gonacin. The food intake was assessed in WT and CKO zebrafish at 40 dpf (panel a, n = 15 in each group) and 100 dpf (panel b, n = 15 in each group). ∗, p < 0.05; ∗∗, p < 0.01; ∗∗∗, p < 0.001; ∗∗∗∗, p < 0.0001, two-way ANOVA with Sidak’s multiple comparisons test was used to calculate the p value. (E) Lower serum glucose level in CKO fish. Adult WT or CKO zebrafish (120 dpf) were subjected to 24 h fasting before serum glucose measurement. ∗, p < 0.05; n = 5. Unpaired Student’s t test was used to calculate the p value. (F) Fertility and gonadal development after CKO of gonacin in zebrafish at 100 dpf. a) Number of embryos produced in WT and CKO female zebrafish after crossing with WT males. ∗∗∗∗, p < 0.0001 (n = 7 in each group). b) Morphology of ovaries dissected from WT and CKO female zebrafish (Left panel: dashed areas denote the ovary, scale bar: 1 cm. Right panel: ovaries isolated and dispersed, scale bar: 1.5 mm). c) Gonadosomatic Index (GSI) of WT and CKO female zebrafish. ∗∗∗, p < 0.001, compared with WT female zebrafish (n = 7 in each group). d) Histology of ovaries from WT and CKO female zebrafish. e) Percentage of different stage follicles in WT and CKO female zebrafish. ∗∗, p < 0.01; ∗∗∗∗, p < 0.0001, compared with WT female zebrafish. The data were derived from 3 individual zebrafish. PG, primary growth stage; PV, pre-vitellogenic stage; EV, early-vitellogenic stage; MV, mid-vitellogenic stage; FG, fully grown stage follicles. Scale bar: 100 μm. |
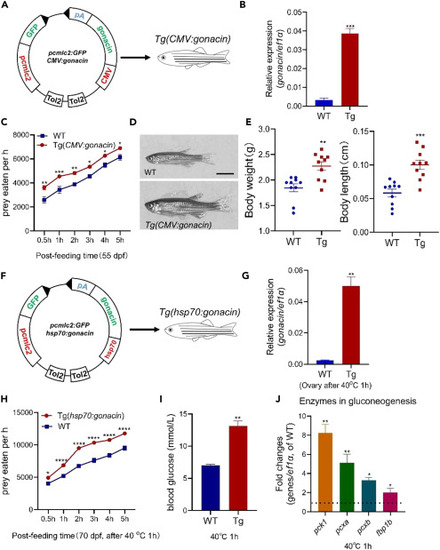
Overexpression of gonacin in the whole body could enhance the body growth, serum glucose, and food intake of zebrafish (A) Overexpression of gonacin in whole body by the establishment of gonacin transgenic zebrafish driven by CMV promoter. (B) The expression of gonacin was detected in the embryos of wild type (WT) and Tg(CMV:gonacin) at 8 dpf, using ef1a as an internal control. ∗∗∗, p < 0.001; Unpaired Student’s t test was used to calculate the p value. (C) Assessment of the food intake in Tg(CMV:gonacin). The food intake was assessed in WT and Tg(CMV:gonacin) at 55 dpf (panel a, n = 15 in each group). ∗, p < 0.05; ∗∗, p < 0.01; ∗∗∗, p < 0.001; two-way ANOVA with Sidak’s multiple comparisons test was used to calculate the p value. (D) The morphology of WT and Tg(CMV:gonacin) zebrafish at 50 dpf. Scale bar: 0.5 cm. (E) Body weight (left panel) and body length (right panel) of WT and Tg(CMV:gonacin) at 50 dpf. ∗∗, p < 0.01; ∗∗∗, p < 0.001 compared with WT (n = 10). (F) Overexpression of gonacin in whole body by the establishment of gonacin transgenic zebrafish driven by hsp70 promoter. (G) The expression of gonacin was detected in the ovary of wild type (WT) and Tg(hsp70:gonacin) at 70 dpf after after 40°C heat shock for 1 h (n = 5 in each group), using ef1a as an internal control. ∗∗, p < 0.01; Unpaired Student’s t test was used to calculate the p value. (H) Assessment of the food intake in Tg(hsp70:gonacin). The food intake was assessed in WT and Tg(hsp70:gonacin) at 70 dpf (panel a, n = 15 in each group). ∗, p < 0.05; ∗∗∗∗, p < 0.0001, two-way ANOVA with Sidak’s multiple comparisons test was used to calculate the p value. (I) Assessment of the blood glucose in Tg(hsp70:gonacin). The blood glucose was assessed in WT and Tg(hsp70:gonacin) at 70 dpf after 40°C heat shock for 1 h (n = 5 in each group). ∗∗, p < 0.01; Unpaired Student’s t test was used to calculate the p value. (J) The expression of glucogenesis enzymes including pck1, pcxa, pcxb, and fbp1b, in the liver in WT and Tg(hsp70:gonacin) at 70 dpf after 40°C heat shock for 1 h (n = 5 in each group). The columns represent fold changes of the relative mRNA levels in the Tg(hsp70:gonacin) group over its respective WT controls (mean ± SEM) ∗, p < 0.05; ∗∗, p < 0.01; n = 5. Unpaired Student’s t test was used to calculate the p value. To further confirm the essential role of gonacin on food intake and glucose secretion, we constructed an inducible transgenic fish line (Tg(hsp70:gonacin)) driven by the heat shock protein 70 (hsp70) promoter (Figure 6F). The gonacin mRNA was increased in this transgenic zebrafish as assessed in the ovary at 70 dpf after from 28 to 40OC (heat shock) for 1 h (Figure 6G). The food intake and serum glucose levels were increased after heat shock for 1 h (Figures 6H and 6I). Levels of several key enzymes in gluconeogenesis including pck1, pcxa, pcxb, and fbp1b were increased in the liver after heat shock for 1 h. as detected by real-time qPCR (Figure 6J). These findings indicate that food intake, serum glucose level, and gluconeogenesis could be enhanced by transient overexpression of gonacin in zebrafish. Gonacin is highly expressed in germ cells. In order to check the effects of gonacin overexpression in germ cells, we further established Tg(piwil1:gonacin) and Tg(vasa:gonacin) fish lines. In the Tg(piwil1:gonacin) fish line (Figure 7A), the body weight and body length of transgenic fish were higher than those in WT fish at 50 dpf (Figure 7B). Food intake was increased in this transgenic fish at 70 dpf (Figure 7C). Also, the ovary size and weight were significantly increased in the Tg(piwil1:gonacin) at 50 dpf (Figures 7D and 7E). Histological analyses at 50 dpf further showed that FG stage follicles were found in transgenic but not in WT ovaries (Figure 7F). Likewise, in the Tg(vasa:gonacin) fish line (Figure 7G), body weight and body length of transgenic fish were higher than those in WT fish at 50 dpf (Figure 7H). Also, food intake was increased at 70 dpf (Figure 7I). The ovary size and weight was increased in the Tg(vasa:gonacin) at 50 dpf (Figures 7J and 7K). Histological analyses at 50 dpf further showed that FG stage follicles were found in transgenic but not in WT ovaries (Figure 7L). These findings indicate that body growth, ovarian development, and food intake could be enhanced by overexpression of gonacin in germ cells of zebrafish. |
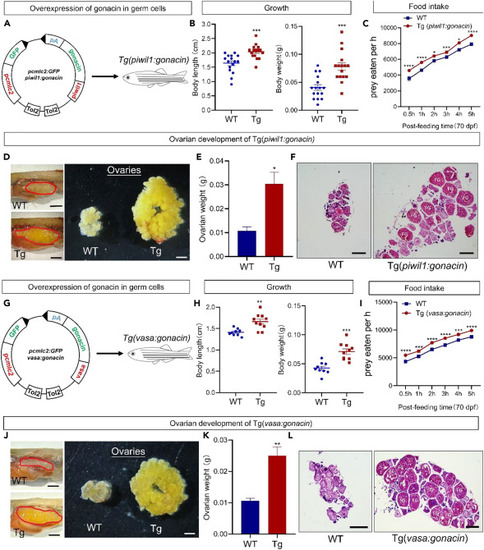
Overexpression of gonacin in germ cells of zebrafish enhanced body growth, gonadal development, and food intake (A) Establishment of Tg(piwil1:gonacin) transgenic zebrafish. (B) Body weight (left panel) and body length (right panel) of WT and Tg(piwil1:gonacin) at 50 dpf. ∗∗∗, p < 0.001 compared with WT (n = 15). (C) Assessment of food intake in Tg(piwil1:gonacin). The food intake was assessed in WT and Tg(piwil1:gonacin) at 70 dpf (panel a, n = 15 in each group). ∗, p < 0.05; ∗∗∗, p < 0.001; ∗∗∗∗, p < 0.0001, two-way ANOVA with Sidak’s multiple comparisons test was used to calculate the p value. (D) Morphology of ovaries dissected from WT and Tg(piwil1:gonacin) female zebrafish (Left panel: dashed areas denote the ovary, scale bar: 0.5 cm. Right panel: ovaries isolated and dispersed, scale bar: 1.5 mm). (E) Ovarian weights of WT and Tg(piwil1:gonacin) zebrafish at 50 dpf. ∗, p < 0.05, compared with WT counterparts (n = 5 in each group). (F) Histology of ovaries from WT and Tg(piwil1:gonacin) female zebrafish at 50 dpf. (G) Establishment of Tg(vasa:gonacin) transgenic zebrafish. Scale bar: 500 μm. (H) Body weight (left panel) and body length (right panel) of WT and Tg(vasa:gonacin) zebrafish at 50 dpf. ∗∗, p < 0.01; ∗∗∗, p < 0.001 compared with WT (n = 10). (I) Assessment of food intake in Tg(vasa:gonacin). Food intake was assessed in WT and Tg(vasa:gonacin) at 70 dpf (panel a, n = 15 in each group). ∗∗∗, p < 0.001; ∗∗∗∗, p < 0.0001, two-way ANOVA with Sidak’s multiple comparisons test was used to calculate the p value. (J) Morphology of ovaries dissected from WT and Tg(vasa:gonacin) female zebrafish (Left panel: dashed areas denote the ovary, scale bar: 0.5 cm. Right panel: ovaries isolated and dispersed, scale bar: 1.5 mm). (K) Ovary weight of WT and Tg(vasa:gonacin) female zebrafish at 50 dpf. ∗∗, p < 0.01, compared with WT females (n = 5 in each group). (L) Histology of ovaries from WT and Tg(vasa:gonacin) female zebrafish at 50 dpf. FG, fully grown stage follicles. Scale bar: 500 μm. |
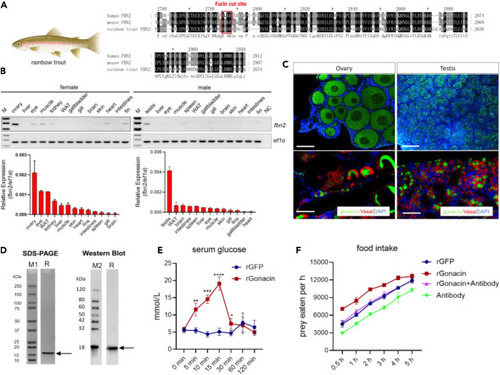
Identification of gonacin in rainbow trout exhibiting gonadal expression and showing glucogenic and orexigenic activities (A) Identification of gonacin in the C-terminal end of rainbow trout Fbn2 with a canonical furin cleavage position. (B) Expression of rainbow trout fbn2 mRNA in different adult tissues detected by RT-PCR followed by electrophoresis (upper panel) and real-time PCR (lower panel). (C) Expression of rainbow trout gonacin in ovary and testis detected by immunostaining. Localization of gonacin signal (Green, upper panel) and co-localization of gonacin (Green) and Vasa (Red) signal (lower panel) in ovary and testis of rainbow trout at 8 months post-fertilization. (D) Characterization of recombinant rainbow trout gonacin protein (rGonacin). Coomassie blue staining and immunoblotting of bacteria-derived rGonacin. M1, M2: marker proteins; R, rGonacin. (E) Serum glucose levels were measured after an intraperitoneal injection of rGonacin in vivo. ∗, p < 0.05; ∗∗, p < 0.01; ∗∗∗, p < 0.001; ∗∗∗∗, p < 0.0001, compared with control (n = 7 in each group). two-way ANOVA with Bonferroni post-test was used to calculate the p value. (F) Food intake was measured at indicated time points after injection of a single dose of rGFP, 5 μg rGonacin or 4 μL anti-gonacin antibodies or following co-injection of 5 μg rGonacin and 4 μL anti-gonacin. |
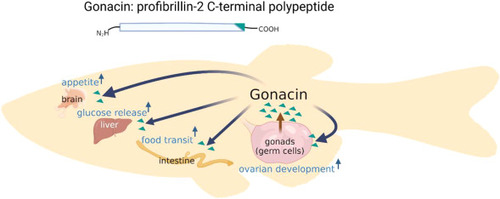
Schematic illustration of the roles of gonacin in the regulation of appetite, glucose release, food transit and ovarian development Gonacin is a C-terminal cleavage product of profibrillin-2 and mainly secreted from the early-stage germ cells of fish, capable of promoting ovarian development. Gonacin can also traffic to the liver, brain and intestine to stimulate glucose release, food intake, and food transit respectively. |