
Fig. 1
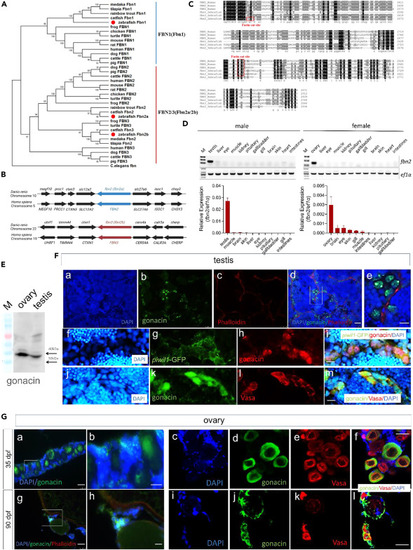
Phylogenic comparison of FBN genes and identification of gonacin in zebrafish gonads (A) Phylogenic tracing of three FBN genes in diverse vertebrates showing three zebrafish paralogs (red dots). (B) Syntenic regions of FBN2 and FBN3 genes in human and zebrafish chromosomes. (C) Discovery of a consensus furin cleavage site upstream of placensin-like sequences in zebrafish Fbn2. Furin cleavage sites were marked by red boxes. The meaning of the number on the right side is the number of amino acids from the translation starting site. (D) Expression of fbn2 transcripts was mainly detected in the gonad tissues of in adult zebrafish as detected by RT-PCR and electrophoresis (upper panel) as well as real-time qPCR (lower panel) in different tissues of adult zebrafish. (E) Expression of gonacin protein was detected by Western blotting in zebrafish ovary and testis. Tissue extracts were subjected to immunoblotting using gonacin antibodies. M: marker protein. (F) Expression of gonacin protein was detected by fluorescence immunostaining in the testis of adult zebrafish. Signals for DAPI (a), gonacin (b), phalloidin (c), and all three (d). (e) shows the signal of the box area indicated in (d). Signals for DAPI (f), GFP driven by the piwi promoter (g), gonacin (h), and all three (i). Signals for DPI (j), gonacin (k), Vasa (L), and all three (n). gonacin (green) and Vasa (red) are localized in germ cells. (g) The co-localization of gonacin (red) and GFP driven by the piwi promoter (green) in spermatogonia cells. DAPI (blue) was used as a nuclear counterstaining and phalloidin (red) was used as an F-actin counterstaining. Scale bar: 25 μm (a, b, c, and d), 10 μm (e, f, g, h, i, j, k, l, m, and n). (G) Expression of gonacin protein was detected by fluorescence immunostaining in zebrafish ovary. Expression of gonacin in the ovary of zebrafish at 35 dpf (a, b, c, d, e, and f) and 90 dpf (g, h, i, j, k, and l). (b) and (h) show amplified areas in (a) and (g), respectively. Signals for gonacin (green, d and j) and Vasa (red, e and k) were in germ cells. DAPI (blue) was used as a nuclear counterstaining (c and i) and all three (f and l). Scale bar: 25 μm (a and g), 20 μm (c, d, e, f, i, j, k, and l), 10 μm (b and h). |