
Fig. 7
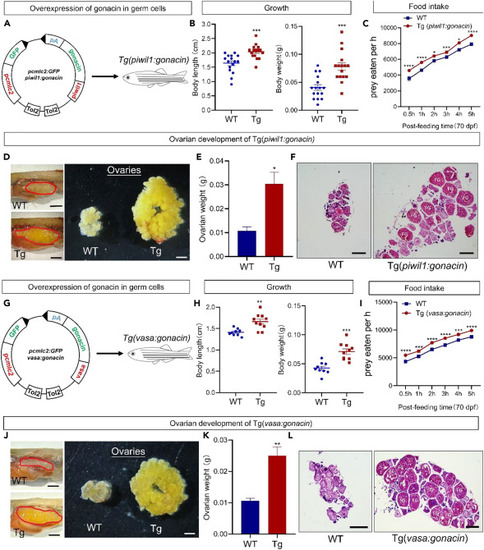
Overexpression of gonacin in germ cells of zebrafish enhanced body growth, gonadal development, and food intake (A) Establishment of Tg(piwil1:gonacin) transgenic zebrafish. (B) Body weight (left panel) and body length (right panel) of WT and Tg(piwil1:gonacin) at 50 dpf. ∗∗∗, p < 0.001 compared with WT (n = 15). (C) Assessment of food intake in Tg(piwil1:gonacin). The food intake was assessed in WT and Tg(piwil1:gonacin) at 70 dpf (panel a, n = 15 in each group). ∗, p < 0.05; ∗∗∗, p < 0.001; ∗∗∗∗, p < 0.0001, two-way ANOVA with Sidak’s multiple comparisons test was used to calculate the p value. (D) Morphology of ovaries dissected from WT and Tg(piwil1:gonacin) female zebrafish (Left panel: dashed areas denote the ovary, scale bar: 0.5 cm. Right panel: ovaries isolated and dispersed, scale bar: 1.5 mm). (E) Ovarian weights of WT and Tg(piwil1:gonacin) zebrafish at 50 dpf. ∗, p < 0.05, compared with WT counterparts (n = 5 in each group). (F) Histology of ovaries from WT and Tg(piwil1:gonacin) female zebrafish at 50 dpf. (G) Establishment of Tg(vasa:gonacin) transgenic zebrafish. Scale bar: 500 μm. (H) Body weight (left panel) and body length (right panel) of WT and Tg(vasa:gonacin) zebrafish at 50 dpf. ∗∗, p < 0.01; ∗∗∗, p < 0.001 compared with WT (n = 10). (I) Assessment of food intake in Tg(vasa:gonacin). Food intake was assessed in WT and Tg(vasa:gonacin) at 70 dpf (panel a, n = 15 in each group). ∗∗∗, p < 0.001; ∗∗∗∗, p < 0.0001, two-way ANOVA with Sidak’s multiple comparisons test was used to calculate the p value. (J) Morphology of ovaries dissected from WT and Tg(vasa:gonacin) female zebrafish (Left panel: dashed areas denote the ovary, scale bar: 0.5 cm. Right panel: ovaries isolated and dispersed, scale bar: 1.5 mm). (K) Ovary weight of WT and Tg(vasa:gonacin) female zebrafish at 50 dpf. ∗∗, p < 0.01, compared with WT females (n = 5 in each group). (L) Histology of ovaries from WT and Tg(vasa:gonacin) female zebrafish at 50 dpf. FG, fully grown stage follicles. Scale bar: 500 μm. |