
Fig. 3
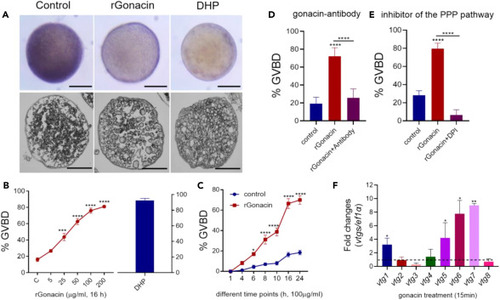
Promotion of oocyte maturation and vitellogenesis by gonacin in zebrafish (A) The morphology (upper panel) and histology (lower panel) of ovarian follicles after treatment with rGonacin (100 μg/mL) for 4 h, using DHP (5 ng/ml) as a positive control. Scale bar: 200 μm. (B) Increased rate of oocyte maturation following treatment with rGonacin at different doses for 16 h. DHP (5 ng/ml) treatment group was used as a positive control. ∗∗∗, p < 0.001; ∗∗∗∗, p < 0.0001, one-way ANOVA followed by Fisher’s least significant difference test was used to calculate the p value. (C) Effects of treatment with rGonacin (100 μg/mL) on the rate of oocyte maturation at indicated time points. ∗, p < 0.05; ∗∗∗∗, p < 0.0001, two-way ANOVA with Sidak’s multiple comparisons test was used to calculate the p value. (D) Effects of treatment with gonacin antibodies for 16 h on the rate of rGonacin-induced oocyte maturation. ∗∗∗∗, p < 0.0001, one-way ANOVA followed by Fisher’s least significant difference test was used to calculate the p value. (E) Blockage of rGonacin-induced oocyte maturation by co-treatment with a PPP inhibitor (DPI) for 16 h. ∗∗∗∗, p < 0.0001, one-way ANOVA followed by Fisher’s least significant difference test was used to calculate the p value. (F) The expression of vtg1-8 in liver after a single intraperitoneal injection of rGonacin (4 μg) or rGFP (control) in vivo. The columns represent fold changes of relative mRNA levels in the treated group over its respective GFP injection controls (mean ± SEM) ∗, p < 0.05; ∗∗, p < 0.01; n = 4. Unpaired Student’s t test was used to calculate the p value. |