
|
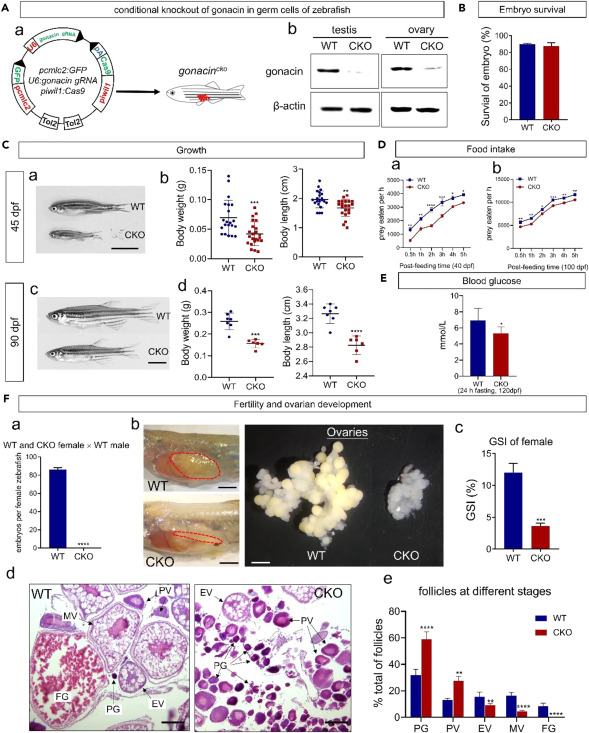
Fig. 5 Conditional knockout of gonacin in germ cells led to defects in appetite, serum glucose level, and ovarian development in zebrafish (A) Conditional knockout (CKO) of gonacin in germ cells of zebrafish. a) Construction of a plasmid for targeted knockout of gonacin in germ cells of zebrafish. b) The expression of gonacin was detected in the testis and ovary of wild type (WT) but negligible in CKO at 80 dpf, using β-actin as an internal control. (B) Embryo survival of WT and CKO zebrafish. (C) Assessment of the growth of zebrafish after CKO of gonacin. a) The morphology of WT and CKO zebrafish at 45 dpf. b) Body weight (left panel) and body length (right panel) of WT and CKO zebrafish at 45 dpf. ∗∗, p < 0.01; ∗∗∗, p < 0.001, compared with WT (n = 21). c) The morphology of WT and CKO zebrafish at 90 dpf. d) Body weight (left panel) and body length (right panel) of WT and CKO zebrafish at 90 dpf. ∗∗∗∗, p < 0.0001, compared with WT (n = 7). Scale bar: 0.5 cm. (D) Assessment on the food intake of zebrafish after CKO of gonacin. The food intake was assessed in WT and CKO zebrafish at 40 dpf (panel a, n = 15 in each group) and 100 dpf (panel b, n = 15 in each group). ∗, p < 0.05; ∗∗, p < 0.01; ∗∗∗, p < 0.001; ∗∗∗∗, p < 0.0001, two-way ANOVA with Sidak’s multiple comparisons test was used to calculate the p value. (E) Lower serum glucose level in CKO fish. Adult WT or CKO zebrafish (120 dpf) were subjected to 24 h fasting before serum glucose measurement. ∗, p < 0.05; n = 5. Unpaired Student’s t test was used to calculate the p value. (F) Fertility and gonadal development after CKO of gonacin in zebrafish at 100 dpf. a) Number of embryos produced in WT and CKO female zebrafish after crossing with WT males. ∗∗∗∗, p < 0.0001 (n = 7 in each group). b) Morphology of ovaries dissected from WT and CKO female zebrafish (Left panel: dashed areas denote the ovary, scale bar: 1 cm. Right panel: ovaries isolated and dispersed, scale bar: 1.5 mm). c) Gonadosomatic Index (GSI) of WT and CKO female zebrafish. ∗∗∗, p < 0.001, compared with WT female zebrafish (n = 7 in each group). d) Histology of ovaries from WT and CKO female zebrafish. e) Percentage of different stage follicles in WT and CKO female zebrafish. ∗∗, p < 0.01; ∗∗∗∗, p < 0.0001, compared with WT female zebrafish. The data were derived from 3 individual zebrafish. PG, primary growth stage; PV, pre-vitellogenic stage; EV, early-vitellogenic stage; MV, mid-vitellogenic stage; FG, fully grown stage follicles. Scale bar: 100 μm.