
|
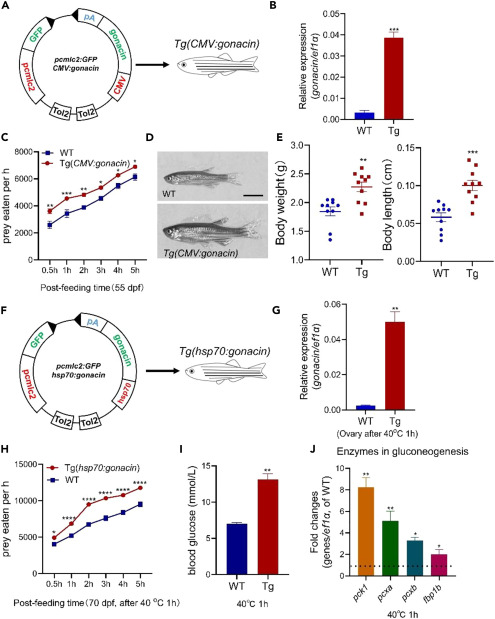
Fig. 6 Overexpression of gonacin in the whole body could enhance the body growth, serum glucose, and food intake of zebrafish (A) Overexpression of gonacin in whole body by the establishment of gonacin transgenic zebrafish driven by CMV promoter. (B) The expression of gonacin was detected in the embryos of wild type (WT) and Tg(CMV:gonacin) at 8 dpf, using ef1a as an internal control. ∗∗∗, p < 0.001; Unpaired Student’s t test was used to calculate the p value. (C) Assessment of the food intake in Tg(CMV:gonacin). The food intake was assessed in WT and Tg(CMV:gonacin) at 55 dpf (panel a, n = 15 in each group). ∗, p < 0.05; ∗∗, p < 0.01; ∗∗∗, p < 0.001; two-way ANOVA with Sidak’s multiple comparisons test was used to calculate the p value. (D) The morphology of WT and Tg(CMV:gonacin) zebrafish at 50 dpf. Scale bar: 0.5 cm. (E) Body weight (left panel) and body length (right panel) of WT and Tg(CMV:gonacin) at 50 dpf. ∗∗, p < 0.01; ∗∗∗, p < 0.001 compared with WT (n = 10). (F) Overexpression of gonacin in whole body by the establishment of gonacin transgenic zebrafish driven by hsp70 promoter. (G) The expression of gonacin was detected in the ovary of wild type (WT) and Tg(hsp70:gonacin) at 70 dpf after after 40°C heat shock for 1 h (n = 5 in each group), using ef1a as an internal control. ∗∗, p < 0.01; Unpaired Student’s t test was used to calculate the p value. (H) Assessment of the food intake in Tg(hsp70:gonacin). The food intake was assessed in WT and Tg(hsp70:gonacin) at 70 dpf (panel a, n = 15 in each group). ∗, p < 0.05; ∗∗∗∗, p < 0.0001, two-way ANOVA with Sidak’s multiple comparisons test was used to calculate the p value. (I) Assessment of the blood glucose in Tg(hsp70:gonacin). The blood glucose was assessed in WT and Tg(hsp70:gonacin) at 70 dpf after 40°C heat shock for 1 h (n = 5 in each group). ∗∗, p < 0.01; Unpaired Student’s t test was used to calculate the p value. (J) The expression of glucogenesis enzymes including pck1, pcxa, pcxb, and fbp1b, in the liver in WT and Tg(hsp70:gonacin) at 70 dpf after 40°C heat shock for 1 h (n = 5 in each group). The columns represent fold changes of the relative mRNA levels in the Tg(hsp70:gonacin) group over its respective WT controls (mean ± SEM) ∗, p < 0.05; ∗∗, p < 0.01; n = 5. Unpaired Student’s t test was used to calculate the p value. To further confirm the essential role of gonacin on food intake and glucose secretion, we constructed an inducible transgenic fish line (Tg(hsp70:gonacin)) driven by the heat shock protein 70 (hsp70) promoter (Figure 6F). The gonacin mRNA was increased in this transgenic zebrafish as assessed in the ovary at 70 dpf after from 28 to 40OC (heat shock) for 1 h (Figure 6G). The food intake and serum glucose levels were increased after heat shock for 1 h (Figures 6H and 6I). Levels of several key enzymes in gluconeogenesis including pck1, pcxa, pcxb, and fbp1b were increased in the liver after heat shock for 1 h. as detected by real-time qPCR (Figure 6J). These findings indicate that food intake, serum glucose level, and gluconeogenesis could be enhanced by transient overexpression of gonacin in zebrafish. Gonacin is highly expressed in germ cells. In order to check the effects of gonacin overexpression in germ cells, we further established Tg(piwil1:gonacin) and Tg(vasa:gonacin) fish lines. In the Tg(piwil1:gonacin) fish line (Figure 7A), the body weight and body length of transgenic fish were higher than those in WT fish at 50 dpf (Figure 7B). Food intake was increased in this transgenic fish at 70 dpf (Figure 7C). Also, the ovary size and weight were significantly increased in the Tg(piwil1:gonacin) at 50 dpf (Figures 7D and 7E). Histological analyses at 50 dpf further showed that FG stage follicles were found in transgenic but not in WT ovaries (Figure 7F). Likewise, in the Tg(vasa:gonacin) fish line (Figure 7G), body weight and body length of transgenic fish were higher than those in WT fish at 50 dpf (Figure 7H). Also, food intake was increased at 70 dpf (Figure 7I). The ovary size and weight was increased in the Tg(vasa:gonacin) at 50 dpf (Figures 7J and 7K). Histological analyses at 50 dpf further showed that FG stage follicles were found in transgenic but not in WT ovaries (Figure 7L). These findings indicate that body growth, ovarian development, and food intake could be enhanced by overexpression of gonacin in germ cells of zebrafish.