
Fig. 4
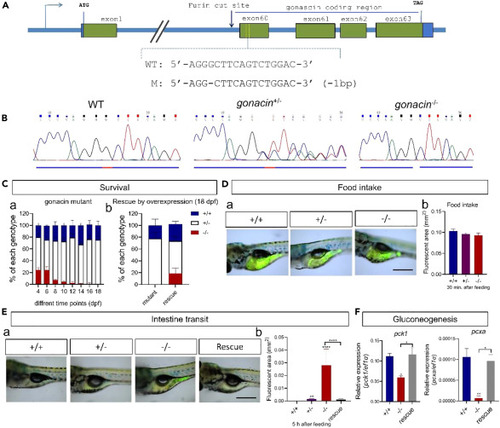
Overexpression of gonacin rescued the larvae lethality phenotype of gonacin null zebrafish (A) Location of the CRISPR/Cas9 binding sites on first exon encoding gonacin of zebrafish to generate gonacin null fish. (B) Sequencing results from the wildtype (WT, gonacin+/+), heterozygous (gonacin+/−), and homozygous (gonacin−/−) zebrafish. (C) Percentages of WT, heterozygous, and homozygous fish during early development from 4 to 18 dpf of zebrafish (n = 20 in each day) (Left panel). Percentages of WT, heterozygous and homozygous fish after overexpression of gonacin in gonacin null zebrafish at 18 dpf (n = 20 in each group) (Right panel). (D) Food intake was assessed by feeding food with luminal tracer in the larvae of WT (+/+) and gonacin mutant fish. a) Individual exhibiting the signal of luminal tracer in the intestine of WT, gonacin heterozygous (+/−) and gonacin homozygous (−/−) fish (7 dpf) after 30 min post feeding. b) Quantitative analysis of luminal tracer signals in the intestine of WT, gonacin+/− and gonacin−/− at 7 dpf at 30 min post-feeding. Scale bar: 0.5 mm. (E) Intestinal transit of food was assessed in zebrafish larvae of WT, gonacin mutants, and gonacin mutants rescued by overexpression of gonacin. a) Individuals exhibiting luminal tracer signals in the intestine of different groups. Rescue: gonacin homozygous rescued by overexpression of gonacin. All zebrafish larvae (7 dpf) were monitored at 5 h after feeding. b) Quantitative analysis of luminal tracer signals in the intestine of different groups. ∗∗, p < 0.01; ∗∗∗∗, p < 0.0001; n = 8. One-way ANOVA followed by Fisher’s least significant difference test was used to calculate the p value. Scale bar: 0.5 mm. (F) The expression of glucogenesis enzymes (pck1 and pcxa) in the liver of WT, gonacin mutants, and gonacin mutants rescued by overexpression of gonacin. ∗, p < 0.05; ∗∗, p < 0.01; n = 5. Unpaired Student’s t test was used to calculate the p value. One-way ANOVA followed by Fisher’s least significant difference test was used to calculate the p value. |