FIGURE SUMMARY
Title

Mutant zebrafish lacking slc25a22a show spontaneous seizures and respond to the anti-seizure medication valproic acid

Authors
Lee, S.H., Liang, T., Chandrasekaran, G., Zhang, J., Kim, S.S., Parvathi, S.V., Lee, S.W., Cho, E.S., Shin, H.Y., Yoon, Y.G., Jo, J., Bae, M.A., Choi, S.Y., Kim, M.K.
Source
Full text @ Dis. Model. Mech.

Clinical profiles of an epilepsy patient with SLC25A22 mutation. (A) An electroencephalogram of the patient at the age of 24. (B-D) Brain magnetic resonance imaging of the patient at the age of 9. T2-weighted sagittal (B), axial (C) and fluid-attenuated inversion recovery (FLAIR; D) images are shown. White arrows indicate the left cortical heterotopia.

Zebrafish slc25a22a is expressed in the brain, intestine and swim bladder, and Slc25a22a is localized in mitochondria of the forebrain. (A) Upper row: wild-type (WT) zebrafish larvae at 3-5 days post-fertilization (dpf) were probed with the slc25a22a riboprobe. Lateral view anterior to the left. The boxed areas are magnified in the respective panels in the lower row. Left, lateral view; right, dorsal view anterior to the left. Scale bars: 300 μm (upper); 100 μm (lower). (B) Cross-section images of the intestine and swim bladder of larvae at 5 dpf in A. Scale bar: 10 μm. (C) Co-transfection of COS-7 cells with the plasmid encoding GFP-tagged zebrafish Slc25a22a and the plasmid encoding mitochondrially targeted DsRed. Scale bar: 20 μm. (D) GFP-tagged slc25a22a RNAs were microinjected into a one-cell-stage Tg(mito:dsred) embryo, and its forebrain region was imaged at 1 dpf. Scale bar: 10 μm.

slc25a22aΔ5/Δ5 and slc25a22aΔ182/Δ182 mutants are generated with CRISPR-Cas9 technology. (A) Upper: schematic of the zebrafish slc25a22a locus and location of CRISPR-Cas9 targets (red arrows); lower: schematic of Slc25a22a proteins translated in WT and slc25a22aΔ182/Δ182 mutants generated with the CRISPR-Cas9 technology. The blue and yellow boxes indicate WT and introduced amino acids (aa), respectively, and the red bar represents a premature stop codon. (B) RT-PCR analysis of the targeted slc25a22a region in the indicated alleles. mRNAs were harvested from zebrafish larvae at 5 dpf and amplified with gene-specific primers. β-Actin primers were used for loading control. (C) Western blot analysis of Slc25a22 proteins in 5 dpf larvae with the indicated alleles. Actin protein was used as a loading control. (D) Larvae with the indicated alleles at 5 dpf were imaged under a light microscope. Lateral view anterior to the left. Scale bar: 200 μm. (E) slc25a22a+/+ (n=16), slc25a22a+/− (n=49) and slc25a22a−/− (n=39) embryos were raised to 15 dpf, and their respective Kaplan–Meier survival rate curves were generated.

slc25a22aΔ182/Δ182 mutants display spontaneous seizures. (A) Representative locomotor activity traces of slc25a22a+/+, slc25a22a+/Δ182 and slc25a22aΔ182/Δ182 larvae at 5 dpf for 10 min. (B) Representative traces of swim maximum velocity (cm/5 s) in slc25a22a+/+ (green), slc25a22a+/Δ182 (blue) and slc25a22aΔ182/Δ182 (red) larvae at 5 dpf for 10 min. (C-E) The total swimming distance (C), maximum swimming velocity (D) and moving frequency (over 10 cm/s) (E) assessed for 10 min in slc25a22a+/+, slc25a22a+/Δ182 and slc25a22aΔ182/Δ182 larvae at 5 dpf. Data are presented as mean±s.d. ns, not significant; ****P<0.0001 by one-way ANOVA with Tukey's honest significant difference (HSD) post hoc test (n=40 embryos per each group). (F) Representative local field potential (LFP) recordings of slc25a22a+/+ (n=40), slc25a22a+/Δ182 (n=40) and slc25a22aΔ182/Δ182 larvae (n=47) at 5 dpf. Boxed areas are magnified in the respective right panel. (G) Frequency of spikes above 0.2 mV was measured in slc25a22a+/+, slc25a22a+/Δ182 and slc25a22aΔ182/Δ182 larvae at 5 dpf. Data are presented as mean±s.d. ns, not significant; **P< 0.01 and ***P< 0.001 by one-way ANOVA with Tukey's HSD post hoc test. Of note, the experiments shown in F and G were performed simultaneously with those in Fig. 6C,D using shared +/+ and Δ182/Δ182 groups.

slc25a22aΔ182/Δ182 larvae exhibit elevated Ca2+ propagation from the midbrain to the spinal cord. (A) Tg(elavl3:Gal4,UAS:GCaMP6s) embryos at 5 dpf expressing GCaMP6s, a Ca2+ indicator, in mature neurons were subjected to time-lapse imaging for 20 min. WT larvae were exposed to 10 mM pentylenetetrazol (PTZ) for 30 min before the imaging. Scale bar: 300 μm. (B) Frequency of Ca2+ propagation from the midbrain to the spinal cord was measured for 20 min. Data are presented as mean±s.d. ns, not significant; **P<0.01 and ****P<0.0001 by one-way ANOVA with Tukey's HSD post hoc test (slc25a22a+/+, n=39; slc25a22a+/Δ182, n=40; slc25a22aΔ182/Δ182, n=42; WT+PTZ, n=40). Of note, the experiments shown in A and B were performed simultaneously with those in Fig. 6E,F using shared +/+ and Δ182/Δ182 groups.

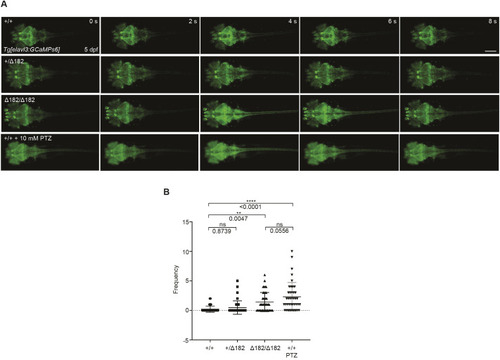
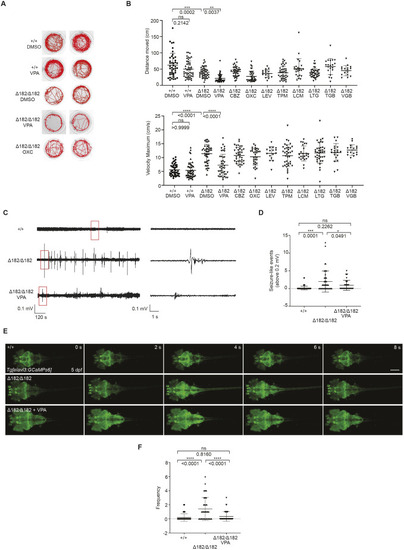
Valproic acid can suppress the spontaneous seizure activities in slc25a22aΔ182/Δ182 larvae. (A) Representative locomotor activity traces recorded for 10 min in 5 dpf slc25a22a+/+ and slc25a22aΔ182/Δ182 larvae exposed to 300 μM valproic acid (VPA) and 50 μM oxcarbazepine (OXC). DMSO, dimethyl sulfoxide. (B) slc25a22aΔ182/Δ182 larvae at 5 dpf were exposed to the indicated anti-seizure medications (ASMs), and their total swimming distance and velocity maximum were measured. Data are presented as mean±s.d. ns, not significant; **P<0.01 and ***P<0.001 and ****P<0.0001 by one-way ANOVA with Tukey's HSD post hoc test. No statistically significant differences were noted between Δ182+DMSO and Δ182+all ASMs except for VPA. slc25a22a+/+ or slc25a22aΔ182/Δ182 + DMSO, n=43 each; slc25a22aΔ182/Δ182 + VPA, n=41; slc25a22aΔ182/Δ182 + carbamazepine (CBZ) or lamotrigine (LTG), n=38 each; slc25a22aΔ182/Δ182 + OXC, n=16; slc25a22aΔ182/Δ182 + lacosamide (LCM), n=24; slc25a22aΔ182/Δ182 + levetiracetam (LEV), n=37; slc25a22aΔ182/Δ182 + topiramate (TPM), n=33; slc25a22aΔ182/Δ182 + tiagabine (TGB), n=20; slc25a22aΔ182/Δ182 + vigabatrin (VGB), n=16. (C) Representative recordings of LFP in 5 dpf slc25a22a+/+, slc25a22aΔ182/Δ182 and slc25a22aΔ182/Δ182 larvae treated with VPA. Boxed areas are magnified in the respective right panel. (D) Frequency of spikes above 0.2 mV was measured in the larvae in C. Data are presented as mean±s.d. ns, not significant; *P<0.05 and ***P<0.001 by one-way ANOVA with Tukey's HSD post hoc test (slc25a22a+/+, n=40; slc25a22aΔ182/Δ182: n=47, slc25a22aΔ182/Δ182+VPA, n=36). (E) Representative images of Tg(elavl3:Gal4,UAS:GCaMP6s) larvae at 5 dpf with the indicated genotypes subjected to time-lapse imaging for 20 min. Scale bar: 300 μm. (F) Frequency of Ca2+ propagation from the midbrain to the spinal cord was measured in the larvae in E for 20 min. Data are presented as mean±s.d. ns, not significant; ****P<0.0001 by one-way ANOVA with Tukey's HSD post hoc test (slc25a22a+/+, n=39; slc25a22aΔ182/Δ182, n=42; slc25a22aΔ182/Δ182 + VPA, n=43). Of note, the experiments shown in C and D, and the experiments shown in E and F, were performed simultaneously with those in Fig. 4F,G and Fig. 5A,B, respectively, using shared +/+ and Δ182/Δ182 groups.

Acknowledgments
This image is the copyrighted work of the attributed author or publisher, and ZFIN has permission only to display this image to its users. Additional permissions should be obtained from the applicable author or publisher of the image. Full text @ Dis. Model. Mech.