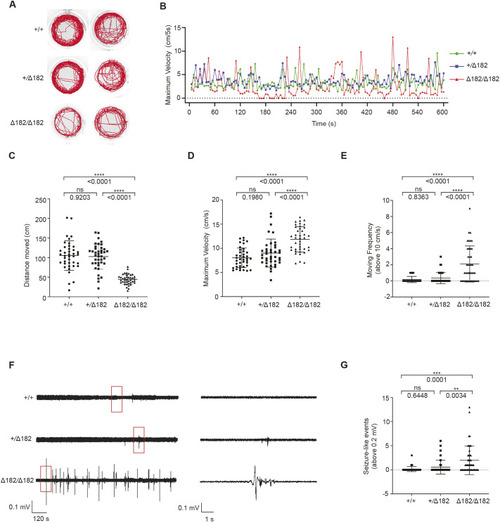
slc25a22aΔ182/Δ182 mutants display spontaneous seizures. (A) Representative locomotor activity traces of slc25a22a+/+, slc25a22a+/Δ182 and slc25a22aΔ182/Δ182 larvae at 5 dpf for 10 min. (B) Representative traces of swim maximum velocity (cm/5 s) in slc25a22a+/+ (green), slc25a22a+/Δ182 (blue) and slc25a22aΔ182/Δ182 (red) larvae at 5 dpf for 10 min. (C-E) The total swimming distance (C), maximum swimming velocity (D) and moving frequency (over 10 cm/s) (E) assessed for 10 min in slc25a22a+/+, slc25a22a+/Δ182 and slc25a22aΔ182/Δ182 larvae at 5 dpf. Data are presented as mean±s.d. ns, not significant; ****P<0.0001 by one-way ANOVA with Tukey's honest significant difference (HSD) post hoc test (n=40 embryos per each group). (F) Representative local field potential (LFP) recordings of slc25a22a+/+ (n=40), slc25a22a+/Δ182 (n=40) and slc25a22aΔ182/Δ182 larvae (n=47) at 5 dpf. Boxed areas are magnified in the respective right panel. (G) Frequency of spikes above 0.2 mV was measured in slc25a22a+/+, slc25a22a+/Δ182 and slc25a22aΔ182/Δ182 larvae at 5 dpf. Data are presented as mean±s.d. ns, not significant; **P< 0.01 and ***P< 0.001 by one-way ANOVA with Tukey's HSD post hoc test. Of note, the experiments shown in F and G were performed simultaneously with those in Fig. 6C,D using shared +/+ and Δ182/Δ182 groups.
|
