IMAGE

Fig. 4.

ID
ZDB-IMAGE-250701-16
Source
Figures for Lee et al., 2025
Image
Figure Caption

Fig. 4.

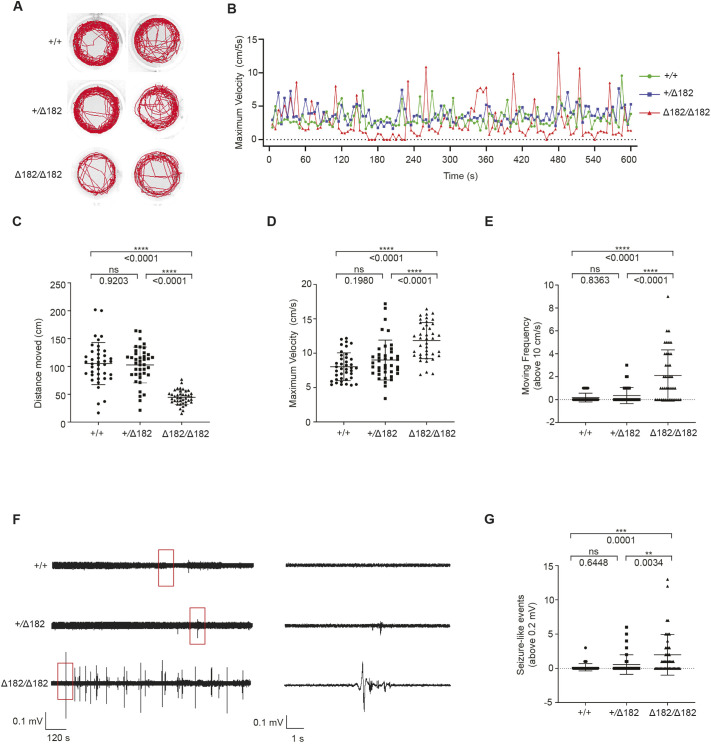
slc25a22aΔ182/Δ182 mutants display spontaneous seizures. (A) Representative locomotor activity traces of slc25a22a+/+, slc25a22a+/Δ182 and slc25a22aΔ182/Δ182 larvae at 5 dpf for 10 min. (B) Representative traces of swim maximum velocity (cm/5 s) in slc25a22a+/+ (green), slc25a22a+/Δ182 (blue) and slc25a22aΔ182/Δ182 (red) larvae at 5 dpf for 10 min. (C-E) The total swimming distance (C), maximum swimming velocity (D) and moving frequency (over 10 cm/s) (E) assessed for 10 min in slc25a22a+/+, slc25a22a+/Δ182 and slc25a22aΔ182/Δ182 larvae at 5 dpf. Data are presented as mean±s.d. ns, not significant; ****P<0.0001 by one-way ANOVA with Tukey's honest significant difference (HSD) post hoc test (n=40 embryos per each group). (F) Representative local field potential (LFP) recordings of slc25a22a+/+ (n=40), slc25a22a+/Δ182 (n=40) and slc25a22aΔ182/Δ182 larvae (n=47) at 5 dpf. Boxed areas are magnified in the respective right panel. (G) Frequency of spikes above 0.2 mV was measured in slc25a22a+/+, slc25a22a+/Δ182 and slc25a22aΔ182/Δ182 larvae at 5 dpf. Data are presented as mean±s.d. ns, not significant; **P< 0.01 and ***P< 0.001 by one-way ANOVA with Tukey's HSD post hoc test. Of note, the experiments shown in F and G were performed simultaneously with those in Fig. 6C,D using shared +/+ and Δ182/Δ182 groups.

Acknowledgments
This image is the copyrighted work of the attributed author or publisher, and ZFIN has permission only to display this image to its users. Additional permissions should be obtained from the applicable author or publisher of the image. Full text @ Dis. Model. Mech.