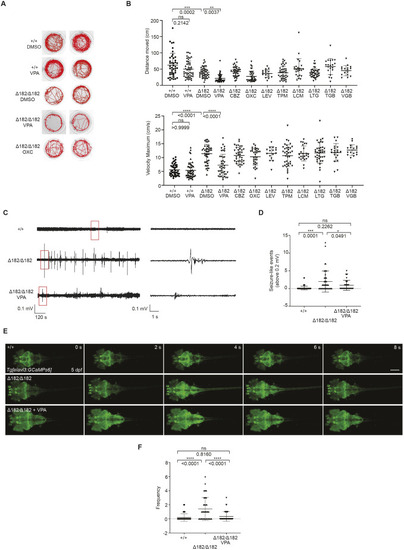
Valproic acid can suppress the spontaneous seizure activities in slc25a22aΔ182/Δ182 larvae. (A) Representative locomotor activity traces recorded for 10 min in 5 dpf slc25a22a+/+ and slc25a22aΔ182/Δ182 larvae exposed to 300 μM valproic acid (VPA) and 50 μM oxcarbazepine (OXC). DMSO, dimethyl sulfoxide. (B) slc25a22aΔ182/Δ182 larvae at 5 dpf were exposed to the indicated anti-seizure medications (ASMs), and their total swimming distance and velocity maximum were measured. Data are presented as mean±s.d. ns, not significant; **P<0.01 and ***P<0.001 and ****P<0.0001 by one-way ANOVA with Tukey's HSD post hoc test. No statistically significant differences were noted between Δ182+DMSO and Δ182+all ASMs except for VPA. slc25a22a+/+ or slc25a22aΔ182/Δ182 + DMSO, n=43 each; slc25a22aΔ182/Δ182 + VPA, n=41; slc25a22aΔ182/Δ182 + carbamazepine (CBZ) or lamotrigine (LTG), n=38 each; slc25a22aΔ182/Δ182 + OXC, n=16; slc25a22aΔ182/Δ182 + lacosamide (LCM), n=24; slc25a22aΔ182/Δ182 + levetiracetam (LEV), n=37; slc25a22aΔ182/Δ182 + topiramate (TPM), n=33; slc25a22aΔ182/Δ182 + tiagabine (TGB), n=20; slc25a22aΔ182/Δ182 + vigabatrin (VGB), n=16. (C) Representative recordings of LFP in 5 dpf slc25a22a+/+, slc25a22aΔ182/Δ182 and slc25a22aΔ182/Δ182 larvae treated with VPA. Boxed areas are magnified in the respective right panel. (D) Frequency of spikes above 0.2 mV was measured in the larvae in C. Data are presented as mean±s.d. ns, not significant; *P<0.05 and ***P<0.001 by one-way ANOVA with Tukey's HSD post hoc test (slc25a22a+/+, n=40; slc25a22aΔ182/Δ182: n=47, slc25a22aΔ182/Δ182+VPA, n=36). (E) Representative images of Tg(elavl3:Gal4,UAS:GCaMP6s) larvae at 5 dpf with the indicated genotypes subjected to time-lapse imaging for 20 min. Scale bar: 300 μm. (F) Frequency of Ca2+ propagation from the midbrain to the spinal cord was measured in the larvae in E for 20 min. Data are presented as mean±s.d. ns, not significant; ****P<0.0001 by one-way ANOVA with Tukey's HSD post hoc test (slc25a22a+/+, n=39; slc25a22aΔ182/Δ182, n=42; slc25a22aΔ182/Δ182 + VPA, n=43). Of note, the experiments shown in C and D, and the experiments shown in E and F, were performed simultaneously with those in Fig. 4F,G and Fig. 5A,B, respectively, using shared +/+ and Δ182/Δ182 groups.
|