IMAGE

Fig. 3.

ID
ZDB-IMAGE-250701-15
Source
Figures for Lee et al., 2025
Image
Figure Caption

Fig. 3.

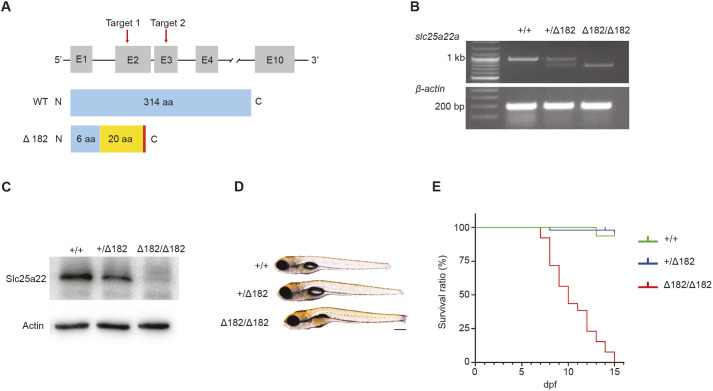
slc25a22aΔ5/Δ5 and slc25a22aΔ182/Δ182 mutants are generated with CRISPR-Cas9 technology. (A) Upper: schematic of the zebrafish slc25a22a locus and location of CRISPR-Cas9 targets (red arrows); lower: schematic of Slc25a22a proteins translated in WT and slc25a22aΔ182/Δ182 mutants generated with the CRISPR-Cas9 technology. The blue and yellow boxes indicate WT and introduced amino acids (aa), respectively, and the red bar represents a premature stop codon. (B) RT-PCR analysis of the targeted slc25a22a region in the indicated alleles. mRNAs were harvested from zebrafish larvae at 5 dpf and amplified with gene-specific primers. β-Actin primers were used for loading control. (C) Western blot analysis of Slc25a22 proteins in 5 dpf larvae with the indicated alleles. Actin protein was used as a loading control. (D) Larvae with the indicated alleles at 5 dpf were imaged under a light microscope. Lateral view anterior to the left. Scale bar: 200 μm. (E) slc25a22a+/+ (n=16), slc25a22a+/− (n=49) and slc25a22a−/− (n=39) embryos were raised to 15 dpf, and their respective Kaplan–Meier survival rate curves were generated.

Acknowledgments
This image is the copyrighted work of the attributed author or publisher, and ZFIN has permission only to display this image to its users. Additional permissions should be obtained from the applicable author or publisher of the image. Full text @ Dis. Model. Mech.