
- Title
-
BMP signaling pathway member expression is enriched in enteric neural progenitors and required for zebrafish enteric nervous system development
- Authors
- Moore, J.A., Moreno-Campos, R., Noah, A.S., Singleton, E.W., Uribe, R.A.
- Source
- Full text @ Dev. Dyn.
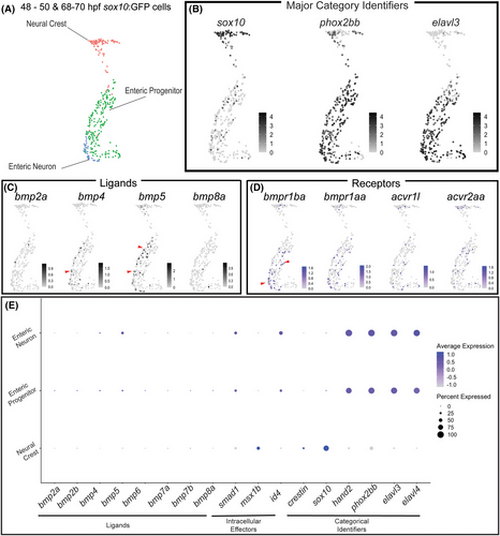
Bone morphogenetic protein (BMP) Pathway members are expressed in various sox10:GFP+ populations, including neural crest and enteric neural progenitors. Uniform Manifold Approximation and Projection (UMAP) analysis of posterior sox10:GFP+ neural crest, enteric progenitors, and enteric neurons from combined 48–50 and 68–70 hpf time points from a previously published data set29 (A). Feature plots demonstrate major categorical identifiers of derivatives (B), expression of BMP ligands (C), or receptors (D). The dot plot depicts the expression of BMP ligands, intracellular effectors, and categorical identifiers (E). Deepness of color denotes higher relative expression of genes. The dot size denotes the percentage of the population expressing the gene of interest. |
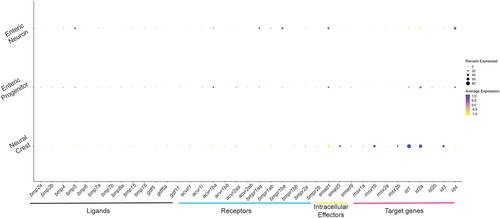
Thirty-seven bone morphogenetic signaling pathway members expressed across sox10 derivatives. The dot plot depicts the transcript expression of bone morphogenetic protein (BMP) ligands, receptors, intracellular targets, and target genes across the neural crest, enteric progenitors, and enteric neurons, as queried from data sets from Howard et al.29 |
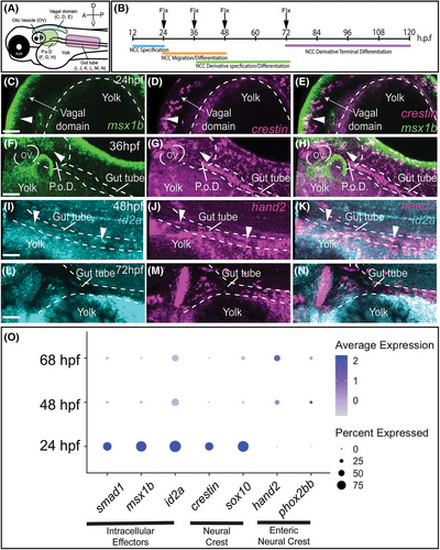
Bone morphogenetic protein (BMP) Pathway target genes are expressed in crestin+ and hand2+ progenitors. Schematic of regions of interest in the zebrafish embryo (A). Whole-mount hybridization chain reaction (HCR) analysis of msx1b and crestin co-expression at 24 hpf (C–E) and 36 hpf (F–H), or id2a and hand2 co-expression at 48 hpf (I–K) and 72 hpf (L–N). White arrows denote regions of co-expression along the dorsal aspect (C, D, E), or in the gut tube (F–N). The dot plot demonstrates the expression of select cell identity and BMP pathway categorical identifiers with intracellular effectors across major developmental times (O). Anterior oriented to the left and dorsal to the top, in these images. The scale bar depicts 50 microns in C, F, I, and L. P.o.D, Post-otic Domain; OV, Otic vesicle, ≥3 experiments with three biological replicates. EXPRESSION / LABELING:
|
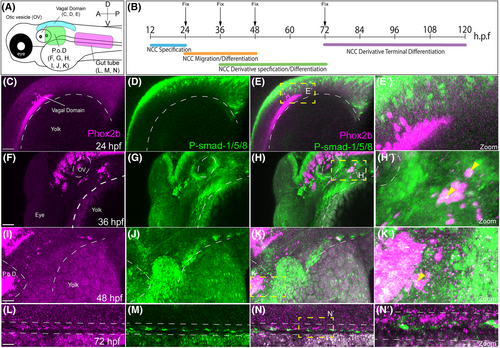
p-SMAD-1/5/8 is present in Phox2b+ enteric progenitors during early phases of enteric development. Schematic of regions of interest in the zebrafish embryo (A), and timepoints assayed for p-SMAD-1/5/8 and enteric neuronal differentiation markers (B). Whole-mount Immunohistochemical analysis of activated BMP signaling by immunostaining of p-Smad-1/5/8 and neurogenesis marker Phox2b at 24 (C–E′), 36 (F–H′), 48 (I–K′), and 72 hpf (L–N′). Boxed region of co-expression of Phox2b and P-Smad1/5/8 (C′, F′, J′, M′). Anterior oriented to the left and dorsal to the top, in these images. Scale bar depicts 50 microns in C, F, I, and L. P.o.D., Post-otic Domain. ≥3 experiments with three biological replicates. EXPRESSION / LABELING:
|
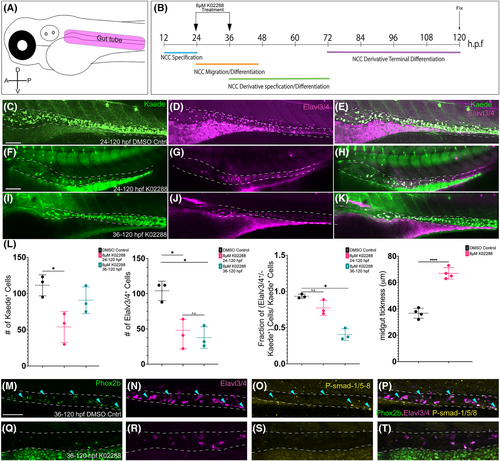
K02288 mediated attenuation of bone morphogenetic protein (BMP) signaling reduced enteric progenitor number in gut tube in a time-dependent manner. Schematic of the region of interest to be imaged for counting enteric neurons in the zebrafish embryo (A). Schematic of treatment paradigm with 8 μM K02288 (B). Whole-mount confocal imaging of the combinatorial expression of Kaede+ and Elavl3/4+ cells after 24–120 hpf DMSO control (C–E), or 24–120hpf (F–H), 36–120 hpf (I–K) 8 μM K02288 treatments. Counts of Kaede+ cells, Elavl3/4+ cells, or percentage of co-positive cells over Kaede+ cells using Imaris image analysis software (L). Measure of midgut thickness, determined using raw confocal images and conversion of pixel number to microns in ImageJ. Anterior oriented to the left and dorsal to the top, in these images. Scale bar in C, F, and I denotes 50 microns. ≥ 3 experiments with three biological replicates. * Denotes p-value < .05. |

bmp5 is expressed in and around the developing enteric progenitors during ENS development. Whole-mount immuno-coupled hybridization chain reaction analysis of novel ENS-related BMP ligand transcript, bmp5, in combination with neuronal markers Phox2b and Elavl3/4 at 24 hpf (A–D′), 36 hpf (E–H′), 48 hpf (I–L′) and 96 hpf (M–P). Scale bar in A, E, I and M denotes 70 microns. OV, otic vesicle. green arrows denote colocalization. ≥ 3 experiments with three biological replicates. |
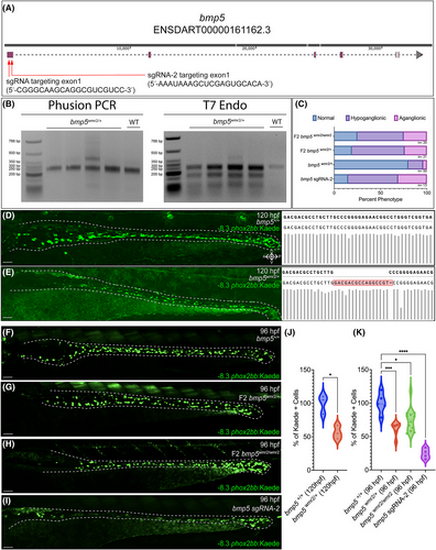
CRISPR mediated mutation in bmp5 reduces − 8.3phox2bb:Kaede+ enteric progenitors. Schematic of bmp5 and CRISPR target regions, red arrows denote the location of the 2 sgRNAs (A). Agarose gel analysis of bmp5 target region amplicon via PCR and T7 endonuclease 1 activity (B). Fraction of ENS phenotypic distributions for bmp5wmr2/+, F2 bmp5wmr2/+, F2 bmp5wmr2/ wmr2, and bmp5 crispant larvae (C). Kaede+ cell reduction in bmp5 F1s at 120 hpf, and F2s and crispants at 96 hpf (E–I), when compared to bmp5+/+ ENS (D, F). The respective sequences around the targeted region of interest, with bmp5+/+ and F1 bmp5wmr2/+ containing a 16-bp insertion (D, E right). Number of Kaede+ cells of the different bmp5 F1s, F2s and crispants in the gut (J, K). ≥3 experiments with three biological replicates. T test p-value *, .0117; ANOVA p-value ****, <0.0001; ***, 0.0008; *, <.01. Scale bar depicts 50 microns. |