
|
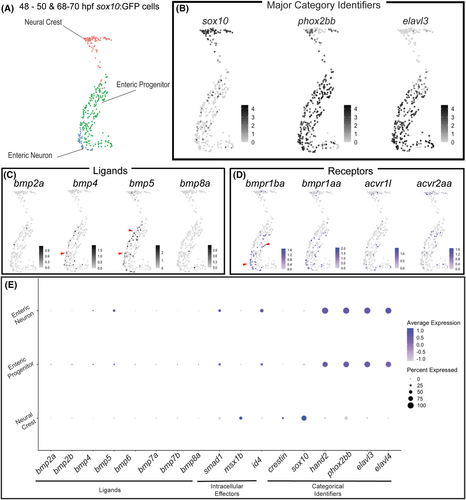
Fig. 1 Bone morphogenetic protein (BMP) Pathway members are expressed in various sox10:GFP+ populations, including neural crest and enteric neural progenitors. Uniform Manifold Approximation and Projection (UMAP) analysis of posterior sox10:GFP+ neural crest, enteric progenitors, and enteric neurons from combined 48–50 and 68–70 hpf time points from a previously published data set29 (A). Feature plots demonstrate major categorical identifiers of derivatives (B), expression of BMP ligands (C), or receptors (D). The dot plot depicts the expression of BMP ligands, intracellular effectors, and categorical identifiers (E). Deepness of color denotes higher relative expression of genes. The dot size denotes the percentage of the population expressing the gene of interest.