
- Title
-
Identification of Environmental Compounds That May Trigger Early Female Puberty by Activating Human GnRHR and KISS1R
- Authors
- Yang, S., Zhang, L., Khan, K., Travers, J., Huang, R., Jovanovic, V.M., Veeramachaneni, R., Sakamuru, S., Tristan, C.A., Davis, E.E., Klumpp-Thomas, C., Witt, K.L., Simeonov, A., Shaw, N.D., Xia, M.
- Source
- Full text @ Endocrinology
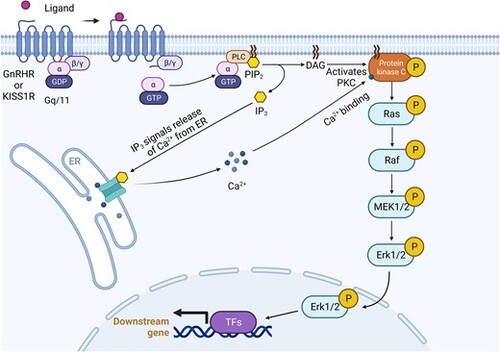
Pathway of gonadotropin-releasing hormone receptor (GnRHR) and/or kisspeptin receptor (KISS1R) activation. |
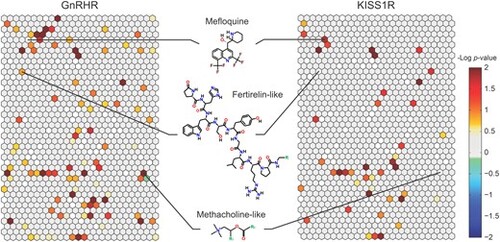
Primary screening for gonadotropin-releasing hormone receptor (GnRHR) and kisspeptin receptor (KISS1R) agonists. The heat map shows the active agonist enrichment data for GnRHR (left) and KISS1R (right) based on the chemical structure similarity clusters generated by the self-organizing map algorithm. In the heat maps, each hexagon represents a cluster of structurally similar compounds. The color gradient indicates the enrichment of active agonists in that specific cluster (negative logarithmic scale of the P value, –log [P value]). Clusters enriched with active agonists range from yellow to red, whereas clusters deficient in active agonists are colored in shades of blue or green. A light gray color indicates that the fraction of active inhibitors in that cluster is close to the library average. Empty clusters with no compounds in them are a darker shade of gray. Each cluster was evaluated for its enrichment of active agonists by comparing the fraction of actives in the cluster with the fraction of actives not in the cluster. Three representative compounds are shown in the center. |
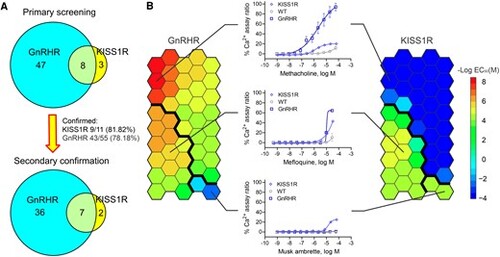
Secondary Ca2+ flux assay confirmation. A, The Venn diagram shows the secondary Ca2+ flux assay confirmation results. B, The heat map shows the half maximum effective value (EC50) distribution of all 45 compounds identified and confirmed from secondary assays based on the self-organizing map (SOM) algorithm. The left panel shows the data from the HEK293-GnRHR cell line, and the right panel shows the data from the HEK293-KISS1R cell line. Red indicates a compound with a low EC50 and high potency, and blue indicates a compound with a high EC50 and low potency. Dark blue indicates a compound was inactive in the tested cell line. Compounds can be separated into 3 groups based on their EC50 in each cell line through the SOM algorithm, as indicated by the bold black line. A representative compound for each group and its concentration-response curve are shown in the middle panel. |
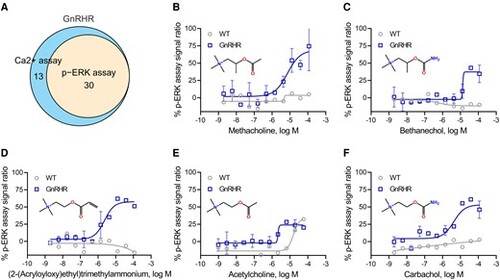
Phosphorylated extracellularly regulated kinase (p-ERK) assay confirmation of gonadotropin-releasing hormone receptor (GnRHR) agonists. A, The Venn diagram shows the p-ERK assay confirmation rate of GnRHR agonist candidates in the HEK293-GnRHR cells. B to F, Concentration-response curves demonstrate that cholinergic agonists, including B, methacholine; C, bethanechol; D, (2-(acryloyloxy)ethyl)trimethylammonium; E, acetylcholine; and F, carbachol, stimulated ERK phosphorylation in HEK293-GnRHR cells but not in wild-type (WT) cells. All values represent the mean ± SD (n = 3 replicates). |
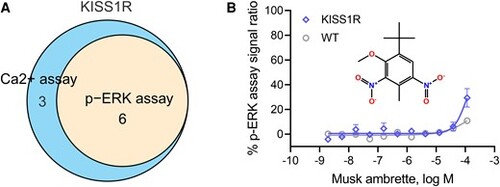
Phosphorylated extracellularly regulated kinase (p-ERK) assay confirmation of a kisspeptin receptor (KISS1R) agonist. A, The Venn diagram shows the p-ERK assay confirmation rate of KISS1R agonist candidates in the HEK293-KISS1R cells. B, Dose-response curves demonstrate that musk ambrette treatment stimulated ERK phosphorylation in HEK293-KISS1R cells but not in wild-type (WT) cells. All values represent the mean ± SD (n = 3 replicates). |
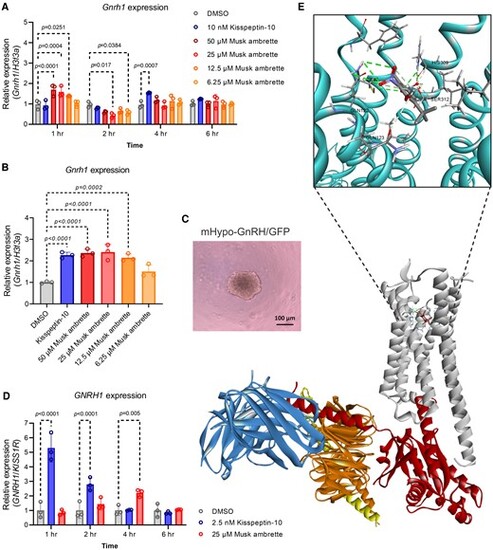
Musk ambrette is a candidate kisspeptin receptor (KISS1R) agonist. A, Gonadotropin-releasing hormone receptor (Gnrh1) expression levels (determined with quantitative reverse-transcription polymerase chain reaction [qRT-PCR]) in murine hypothalamic cells after various concentrations of musk ambrette treatment at 1, 2, 4, or 6 hours. B, Gnrh1 expression levels (determined with qRT-PCR) in murine hypothalamic mHypo-GnRH/GFP spheroids after various concentrations of musk ambrette at 1 hour. C, mHypo-GnRH/GFP spheroid morphology at 6 days pre treatment. There was no change in morphology after treatment (data not shown). Spheroids continued to appear as uniform, solid cell aggregates with a spherical shape and a diameter of approximately 200 to 250 μm. D, GNRH1 expression levels (determined with qRT-PCR) in induced pluripotent stem cells–derived human hypothalamic neurons after 25 μM musk ambrette treatment at 1, 2, 4, or 6 hours. E, Molecular docking predicts the potential binding sites between musk ambrette and KISS1R. All values represent the mean ± SD (n = 3 replicates). Statistical analysis was performed using a 2-way analysis of variance with Tukey multiple-comparison test, and the P value is shown in each graph. |
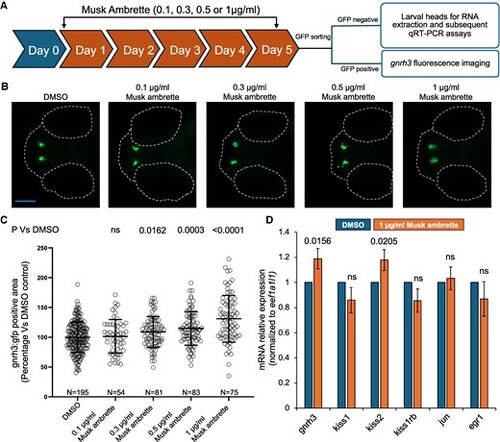
Musk ambrette treatment induces dose-dependent effects on GnRH3 neurons in developing zebrafish. A, Schematic of the experimental workflow. Embryos obtained from adult heterozygous gnrh3:gfp outcrossed with AB wild-type fish were treated with increasing doses of musk ambrette, starting at 1 day post fertilization (dpf) till 5 dpf (n = 15/well/treatment group). At 5 dpf, larvae were sorted for green fluorescent protein (GFP) signal and subjected to live GnRH3 fluorescence imaging or quantitative reverse-transcription polymerase chain reaction (qRT-PCR) based on the presence or absence of GFP signal, respectively. B, Representative dorsal fluorescent images of gnrh3:gfp larvae at 5 dpf. Anterior, left; posterior, right. Dotted lines indicate eyes and the most anterior region of the head. Scale bar shown in blue, 200 μm. C, Column scatter dot plots show quantification of the GnRH3 GFP-positive area in musk ambrette- or dimethyl sulfoxide (DMSO)-treated larvae. At least 2 independent biological replicates for each condition were normalized and pooled to represent percentage vs DMSO control in a single graph. Statistical differences were calculated using an unpaired t test (GraphPad); ns, not significant; error bars represent SD. N = number of larvae. D, Bar graph showing endogenous messenger RNA (mRNA) expression of genes of interest in 5 dpf zebrafish larval heads (human orthologues shown in Supplementary Table S1 (28); kiss2 is a zebrafish paralogue of kiss1 (34). Expression was normalized to eef1a1l1, and statistical differences were calculated using an unpaired t test (GraphPad); ns, not significant; error bars represent SD; n = 25 heads per batch, 3 technical replicates per condition, 3 biological replicates. |
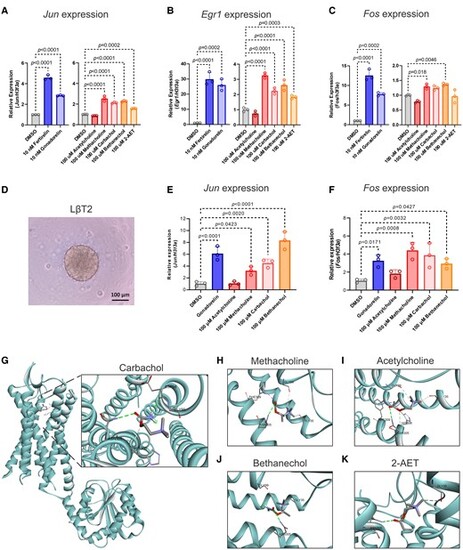
Methacholine-like cholinergic agonists stimulated gene expression in the downstream pathway of the Gonadotropin-releasing hormone receptor (GnRHR). Expression levels (via quantitative reverse-transcription polymerase chain reaction [qRT-PCR]) of A, Jun; B, Egr1; or C, Fos in murine pituitary cells after compound treatment for 2 hours. D, Morphology of LβT2 3-dimensional spheroids at 4 days before treatment. There was no change in morphology after treatment (data not shown). Expression levels (via qRT-PCR) of E, Jun, or F, Fos in murine pituitary LβT2 spheroids after compound treatment for 2 hours. G, Molecular docking studies predict the potential binding between carbachol and GnRHR. Docking energy: −4.2 kcal/mol. H, Molecular docking studies predict the potential binding sites between methacholine and the GnRHR. Docking energy: −4.7 kcal/mol. I, Molecular docking studies predict the potential binding between acetylcholine and GnRHR. Docking energy: −4.3 kcal/mol. J, Molecular docking studies predict the potential binding between bethanechol and GnRHR. Docking energy: −4.6 kcal/mol. K, Molecular docking studies predict the potential binding between (2-(acryloyloxy)ethyl)trimethylammonium (2-AET) and GnRHR. Docking energy: −4.6 kcal/mol. All values represent the mean ± SD (n = 3 replicates). Statistical analysis was performed using a one-way analysis of variance with Tukey multiple-comparison test, and the P value is shown in each graph. |