
|
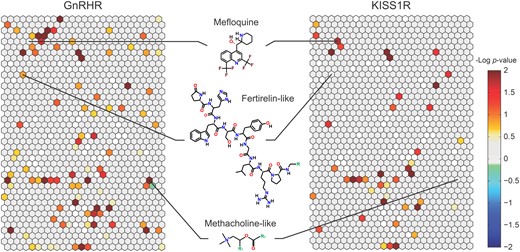
Fig. 2 Primary screening for gonadotropin-releasing hormone receptor (GnRHR) and kisspeptin receptor (KISS1R) agonists. The heat map shows the active agonist enrichment data for GnRHR (left) and KISS1R (right) based on the chemical structure similarity clusters generated by the self-organizing map algorithm. In the heat maps, each hexagon represents a cluster of structurally similar compounds. The color gradient indicates the enrichment of active agonists in that specific cluster (negative logarithmic scale of the P value, –log [P value]). Clusters enriched with active agonists range from yellow to red, whereas clusters deficient in active agonists are colored in shades of blue or green. A light gray color indicates that the fraction of active inhibitors in that cluster is close to the library average. Empty clusters with no compounds in them are a darker shade of gray. Each cluster was evaluated for its enrichment of active agonists by comparing the fraction of actives in the cluster with the fraction of actives not in the cluster. Three representative compounds are shown in the center.