
Fig. 3
- ID
- ZDB-FIG-240912-35
- Publication
- Yang et al., 2024 - Identification of Environmental Compounds That May Trigger Early Female Puberty by Activating Human GnRHR and KISS1R
- Other Figures
- All Figure Page
- Back to All Figure Page
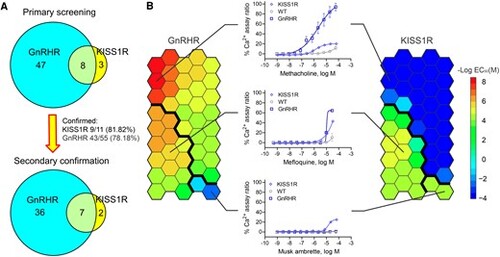
Secondary Ca2+ flux assay confirmation. A, The Venn diagram shows the secondary Ca2+ flux assay confirmation results. B, The heat map shows the half maximum effective value (EC50) distribution of all 45 compounds identified and confirmed from secondary assays based on the self-organizing map (SOM) algorithm. The left panel shows the data from the HEK293-GnRHR cell line, and the right panel shows the data from the HEK293-KISS1R cell line. Red indicates a compound with a low EC50 and high potency, and blue indicates a compound with a high EC50 and low potency. Dark blue indicates a compound was inactive in the tested cell line. Compounds can be separated into 3 groups based on their EC50 in each cell line through the SOM algorithm, as indicated by the bold black line. A representative compound for each group and its concentration-response curve are shown in the middle panel. |