
- Title
-
Species-specific differences in the inhibition of 11β-hydroxysteroid dehydrogenase 2 by itraconazole and posaconazole
- Authors
- Inderbinen, S.G., Zogg, M., Kley, M., Smieško, M., Odermatt, A.
- Source
- Full text @ Tox. App. Pharmacol.
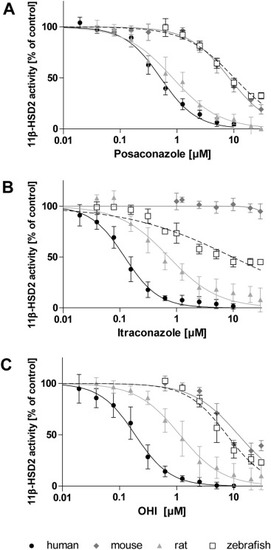
Inhibition of human, mouse, rat and zebrafish 11β-HSD2 activity. Lysates of HEK-293 cells expressing recombinant 11β-HSD2 of the respective species were incubated for 10 min (human) or 20 min (mouse, rat, zebrafish) in the presence of 50 nM cortisol, 500 μM NAD+ and increasing concentrations of posaconazole (A), itraconazole (B) or OHI (C). Substrate conversion was normalized to that of the vehicle control (DMSO; 0.3% for posaconazole, 0.6% for itraconazole and 1.2% for OHI). Inhibition curves were fitted and analyzed by non-linear regression. Data shown are from at least three independent experiments and represent mean ± SD. |
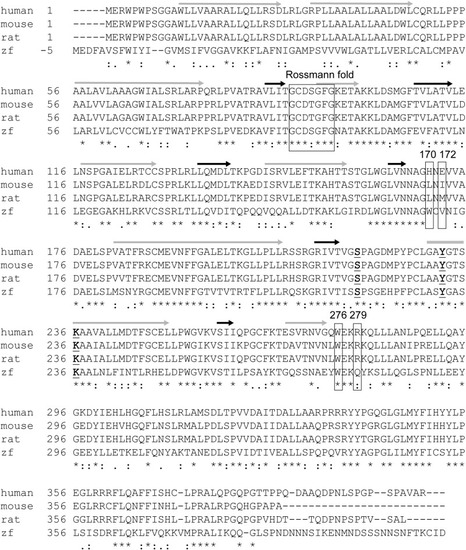
Alignment of human, mouse, rat and zebrafish 11β-HSD2 protein sequences. Symbols are coded as followed: grey arrow, α-helix; black arrow, β-sheets; rectangles, cofactor-binding site in the Rossmann-fold, and positions 170, 172, 276 and 279; underlined and bold letter, active site; (*), fully conserved residues; (:), residues with considerably similar properties; (.), residues with moderately similar properties. |
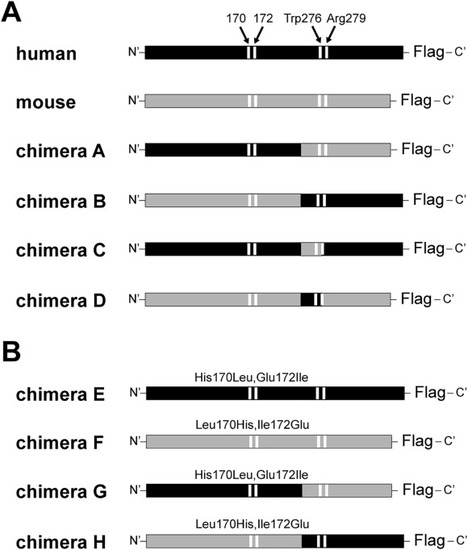
Schematic representation of the cloned 11β-HSD2 mutants. Human sequence is indicated in black, mouse sequence in grey and the positions 170, 172, 276 and 279 are represented by white bars. All sequences were cloned into pcDNA3 and carry a C-terminal FLAG-tag. |
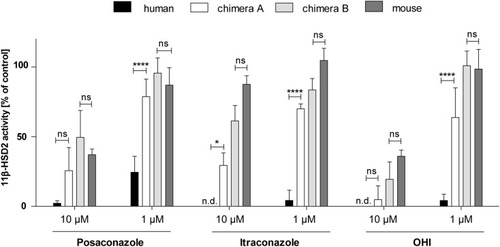
Effect of the substitution of the C-terminal region of human and mouse 11β-HSD2 on azole fungicide-mediated inhibition. Lysates of HEK-293 cells expressing the indicated 11β-HSD2 construct were incubated for 10 min (human, chimera B) or 20 min (mouse, chimera A) with 50 nM cortisol, 500 μM NAD+ and 1 μM or 10 μM of test substances. Substrate conversion was normalized to vehicle control (0.4% DMSO). Data from three independent experiments represent mean ± SD. Two-way ANOVA with Bonferroni's post hoc test, p values: * < 0.05, **** < 0.0001 and ns (not significant), n.d. (not detected). |
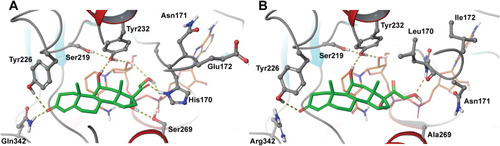
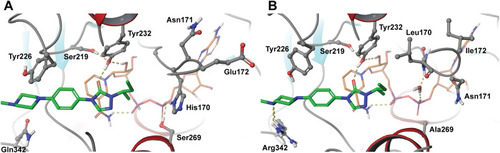
Predicted binding of cortisol (green) and NAD+ (orange) to 11β-HSD2. A) human and B) mouse 11β-HSD2 homology models. Dashed yellow lines indicate relevant hydrogen bond interactions (fulfilling directionality and distance criteria <2.8 Å) for protein-ligand binding. (For interpretation of the references to colour in this figure legend, the reader is referred to the web version of this article.) |
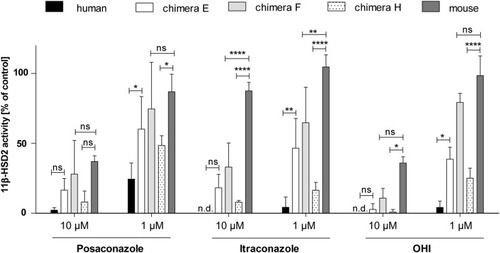
Comparison of the posaconazole-, itraconazole- and OHI-dependent inhibition of human and mouse 11β-HSD2 with that of chimera E, F and H. Lysates of HEK-293 cells expressing recombinant 11β-HSD2 of the indicated species or the respective chimera were incubated for 10 min (human) or 20 min (mouse, chimeras) with 50 nM cortisol, 500 μM NAD+ and 1 μM or 10 μM of the test compounds. Substrate conversion was normalized to that of the vehicle control (0.4% DMSO). Data represent mean ± SD from three independent experiments. Data were analyzed by two-way ANOVA with Bonferroni's post hoc test. P values: * < 0.05, ** < 0.01, **** < 0.0001 and ns (not significant), n.d. (not detected). |
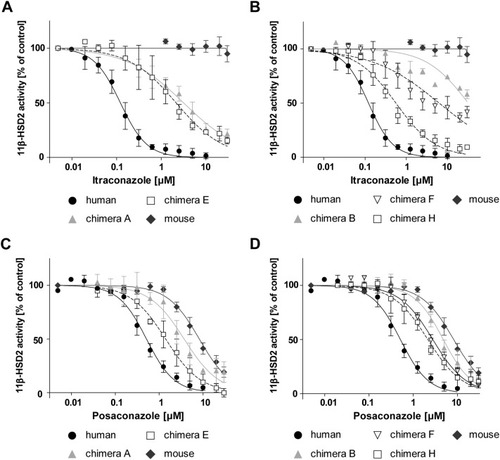
Concentration-dependent inhibition of 11β-HSD2 variants by itraconazole and posaconazole. Lysates of HEK-293 cells expressing recombinant 11β-HSD2 of the indicated species or the respective chimera were incubated for 10 min (human, chimera B) or 20 min (mouse, chimera A, E, F, H) with 50 nM radiolabeled cortisol, 500 μM NAD+ and increasing concentrations of itraconazole (A, B) and posaconazole (C, D). Substrate conversion was normalized to that of the vehicle control (0.6% DMSO for itraconazole and 0.3% DMSO for posaconazole). Data from three independent experiments are shown as mean ± SD. |
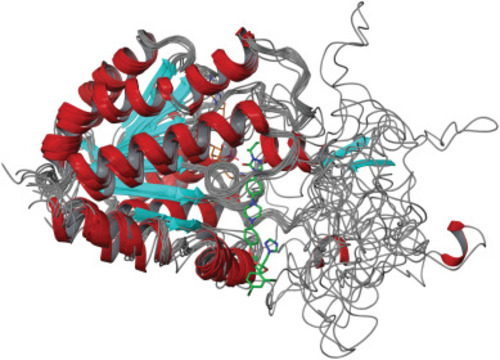
Superposition of 20 human 11β-HSD2 homology models. Alpha helices are represented in red and beta sheets as arrows in turquoise. Itraconazole (green) and the cofactor NAD+ (orange) were docked into the binding pocket. The high variability of the predicted C-terminal region is indicated by the unstructured grey lines. (For interpretation of the references to colour in this figure legend, the reader is referred to the web version of this article.) |
Itraconazole (green) and NAD+ (orange) docked into 11β-HSD2. A) human 11β-HSD2 and B) mouse 11β-HSD2 homology models. Hydrogen bond interactions (fulfilling directionality and distance criteria <2.8 Å) are depicted by yellow dashed lines. (For interpretation of the references to colour in this figure legend, the reader is referred to the web version of this article.) |