
FIGURE
Fig. 9
Fig. 9
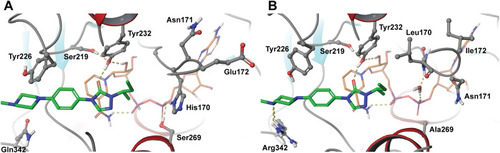
Itraconazole (green) and NAD+ (orange) docked into 11β-HSD2. A) human 11β-HSD2 and B) mouse 11β-HSD2 homology models. Hydrogen bond interactions (fulfilling directionality and distance criteria <2.8 Å) are depicted by yellow dashed lines. (For interpretation of the references to colour in this figure legend, the reader is referred to the web version of this article.) |
Expression Data
Expression Detail
Antibody Labeling
Phenotype Data
Phenotype Detail
Acknowledgments
This image is the copyrighted work of the attributed author or publisher, and
ZFIN has permission only to display this image to its users.
Additional permissions should be obtained from the applicable author or publisher of the image.
Full text @ Tox. App. Pharmacol.