
Image
|
Figure Caption
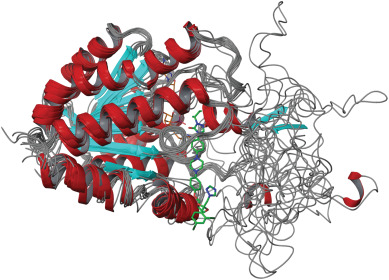
Fig. 8 Superposition of 20 human 11β-HSD2 homology models. Alpha helices are represented in red and beta sheets as arrows in turquoise. Itraconazole (green) and the cofactor NAD+ (orange) were docked into the binding pocket. The high variability of the predicted C-terminal region is indicated by the unstructured grey lines. (For interpretation of the references to colour in this figure legend, the reader is referred to the web version of this article.)
Acknowledgments
This image is the copyrighted work of the attributed author or publisher, and
ZFIN has permission only to display this image to its users.
Additional permissions should be obtained from the applicable author or publisher of the image.
Full text @ Tox. App. Pharmacol.