
FIGURE
Fig. 3
Fig. 3
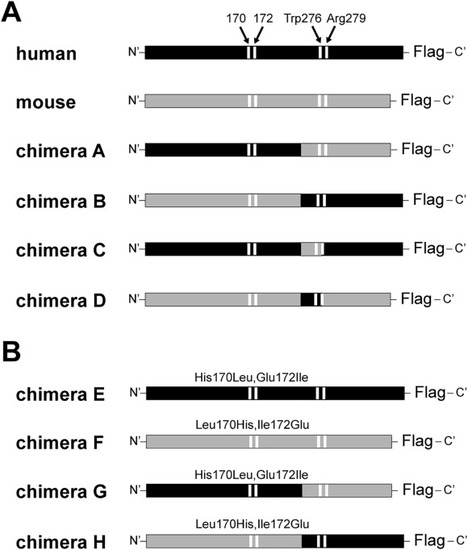
Schematic representation of the cloned 11β-HSD2 mutants. Human sequence is indicated in black, mouse sequence in grey and the positions 170, 172, 276 and 279 are represented by white bars. All sequences were cloned into pcDNA3 and carry a C-terminal FLAG-tag. |
Expression Data
Expression Detail
Antibody Labeling
Phenotype Data
Phenotype Detail
Acknowledgments
This image is the copyrighted work of the attributed author or publisher, and
ZFIN has permission only to display this image to its users.
Additional permissions should be obtained from the applicable author or publisher of the image.
Full text @ Tox. App. Pharmacol.