|
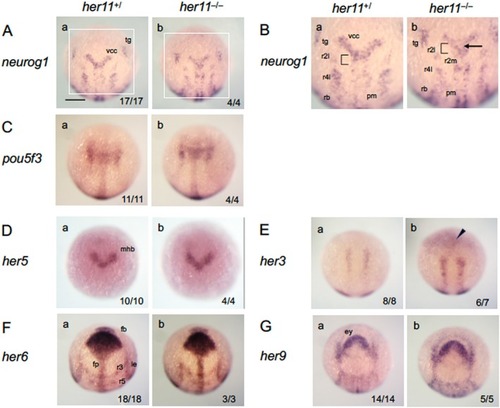
Phenotypic analysis of her11 mutant embryos. Embryos from heterozygous mating (her11+/Δ5) were examined for the expression of neurog1 (A, B), pou5f3 (C), and her genes (D–H) by WISH and photographed, followed by genotyping. A, B. For neurog1 expression, boxed areas in A are enlarged in B. Arrows mark ectopic expression in MIZ (brackets). Solid arrowheads in B show weak upregulation. See the legends to Figures 1 and 3 for abbreviations. Numbers of the embryos with the indicated expression patterns and total scored embryos are shown in the bottom‐right. her11+/+ and her11+/− embryos showed identical phenotypes and were grouped as her11+/, and scored accordingly; images show wild‐type (her11+/+) embryos as representatives. Scale bars, 200 μm.
|