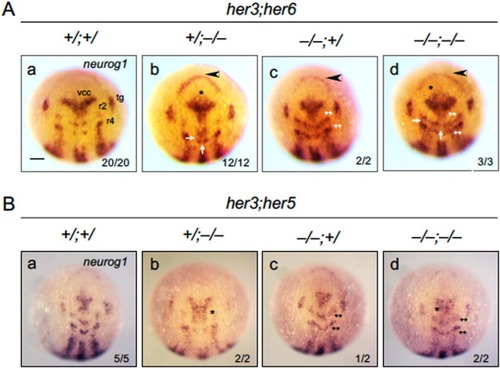
Abnormal neurogenesis in her compound mutants revealed by the expression of neurog1. The expression of neurog1 was examined by WISH in embryos from mating between her3/her6 double heterozygote fish (A, her3+/Δ2; her6+/Δ5) or her3/her5 double heterozygote fish (B, her3+/Δ2; her5+/Δ8) at the bud stage, photographed, and then genotyped. Dorsal views with anterior to the top. Numbers of embryos with the indicated expression patterns and the numbers of total scored embryos are shown in the bottom right. See the text for the symbols, ‘+/;+/’, ‘+/;−/−’, ‘−/−;+/’, and ‘−/−;−/−’). (A) Arrowheads indicate increased expression in the anterior‐most portion of the neural plate, thin horizontal arrows indicate ectopic expression in the r3 region (m‐IPCD‐r3), thick vertical arrows mark md‐IPCD‐r3/5, and single asterisks (*) indicate ectopic expression around drc and vrc. Ectopic expression in IPCD‐r2/IPCD‐r4 is indicated by double asterisks (**). (B) Ectopic expression in MIZ and in IPCD‐r2/IPCD‐4 is marked with single and double asterisks, respectively. For abbreviations, see the legends to Figures 1 and 3. Scale bar, 200 μm.
|
