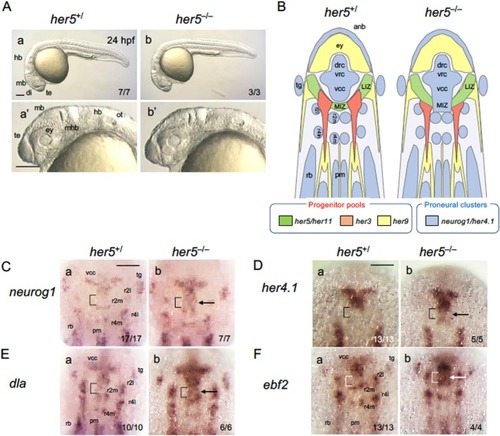
Phenotypes of her5 mutants in the developing brain. (A) Morphology of her5 mutants at 24 hpf. Live embryos from heterozygous mating (her5+/Δ8) were photographed and genotyped. Lateral views of whole embryos (a, b) and heads (a′, b′) are shown with anterior to the left and dorsal to the top. Numbers of embryos with each phenotype and total scored embryos are indicated. Scale bars, 200 μm. (B) Schematic comparison of PCD gene expression in wild‐type (WT, left) and her6 homozygotes (right). Dorsal views (anterior top). (C–F) Expression of proneural cluster domain (PCD)‐related genes in her5 mutants. WISH staining was performed at the bud stage, followed by imaging and genotyping. Dorsal views of the midbrain‐hindbrain region are shown with anterior to the top; whole‐embryo views are shown in Figure S2A. Arrows mark ectopic expression in MIZ (brackets). Numbers of the embryos with the indicated expression patterns and total scored embryos are shown in the bottom‐right. her5+/+ and her5+/− embryos showed identical phenotypes and were grouped as her5+/, and scored accordingly; images show WT (her5+/+) embryos as representatives. Scale bars, 100 μm. di, diencephalon; hb, hindbrain; LIZ, lateral intervening zone; mhb, midbrain‐hindbrain boundary; mb, midbrain; MIZ, medial intervening zone; ot, otocyst; ov, optic vesicle; te, telencephalon. For the remaining abbreviations, see the legends to Figures 1 and 3.
|
