
- Title
-
FRET-Based Sensor Zebrafish Reveal Muscle Cells Do Not Undergo Apoptosis in Starvation or Natural Aging-Induced Muscle Atrophy
- Authors
- Jia, H., Wu, R., Yang, H., Luo, K.Q.
- Source
- Full text @ Adv Sci (Weinh)
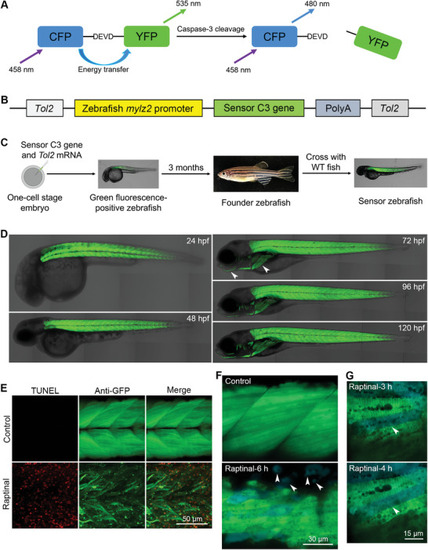
Generation of transgenic sensor zebrafish expressing an apoptotic biosensor in muscle cells. A) The structure and principle of sensor C3. B) The design and components of the |
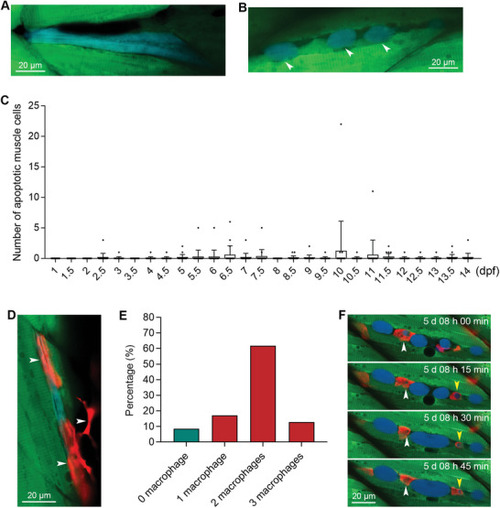
Sensor zebrafish can be used for visualizing developmental muscle cell apoptosis and the engulfment of dead muscle cells by multiple macrophages. A,B) Apoptotic muscle cells during normal zebrafish development. The blue muscle cell in was degraded into smaller fragments, indicated by arrowheads. C) The quantified results show the number of apoptotic muscle cells per zebrafish at different time points during normal development (n = 20 zebrafish for each time point). D) The engulfment of an apoptotic muscle cell by macrophages. The macrophages are indicated with white arrowheads. E) Percentages of apoptotic muscle cells that colocalized with single or multiple macrophages. F) Live tracking of the engulfment of a dead muscle cell by red macrophages. The developmental time is indicated in each image. Two apoptotic bodies engulfed by macrophages are indicated with white and yellow arrowheads, respectively. The size of each scale bar is indicated in each image. |
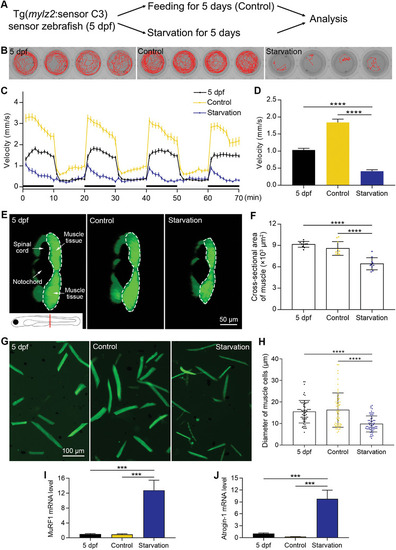
Establishment of a starvation‐induced muscle atrophy model. A) The muscle atrophy model is induced by starvation. B) The swimming trajectories of zebrafish for 5 min. C) Zebrafish locomotion tracking shows the decreased swimming velocity after starvation (n = 24 zebrafish for each group). D) The quantified results of zebrafish locomotion tracking (n = 24 zebrafish for each group). E) Images showing the cross‐sectional areas of muscle tissues. The imaging position and anatomical structures are indicated in the first image. Half of the muscle tissue is imaged, which is circled by a dashed line. F) The quantified results show that the cross‐sectional area of muscle tissues decreased after starvation (n = 10 zebrafish for each group). G) Images of dissociated muscle tissues show a decrease in the diameter of muscle cells after starvation‐induced muscle atrophy. H) The quantified results show that the diameter of muscle cells decreased after starvation (n = 60 cells for each group). I) The mRNA level of MuRF1 increased after starvation. J) The mRNA level of Atrogin‐1 increased after starvation. The size of each scale bar is indicated in each image. *** |
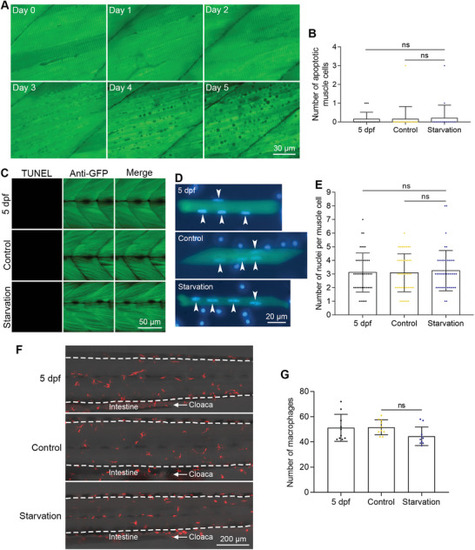
Muscle cells did not undergo apoptosis during starvation‐induced muscle atrophy. A) FRET imaging of muscle cells during zebrafish starvation. The time points after starvation are indicated in each image. B) The quantified results show the number of apoptotic muscle cells during starvation (n = 20 zebrafish for each group). C) TUNEL assays show that no muscle cells die of apoptosis after starvation. D) Nuclear staining of dissociated muscle cells. Nuclei from muscle cells are indicated with arrowheads. E) The quantified results show the number of nuclei of muscle cells after starvation‐induced muscle atrophy (n = 45 cells for each group). F) Live imaging of macrophages in the trunk regions of zebrafish after starvation‐induced atrophy. The intestine and cloaca are marked to show the images were taken from the same region. G) The quantified results show the number of macrophages after starvation‐induced muscle atrophy (n = 10 zebrafish for each group). The size of each scale bar is indicated in each image. ns: no significant difference. |
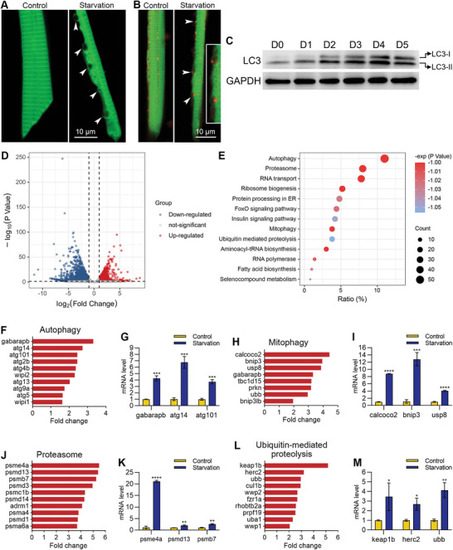
Muscle cells underwent autophagy during starvation‐induced muscle atrophy. A) High‐resolution imaging showing the unique morphology of an autophagic muscle cell. Autophagic vacuoles are indicated with arrowheads. B) Colocalization of autophagic vacuoles and lysosomes. Lysosomes are labeled with LysoTracker red, and autophagic vacuoles are indicated with arrowheads. The two autophagic vacuoles in the middle are enlarged for better illustration. C) Western blotting shows the increase of LC3‐II during starvation treatment. D) A volcano map showing the differentially expressed genes. E) The enrichment analysis shows that the autophagy pathway ranks at the top of up‐regulated genes during starvation‐induced muscle atrophy. F–M) RNA sequencing and qPCR results show the mRNA levels of up‐regulated genes in four pathways after starvation treatment. The size of each scale bar is indicated in each image. * |
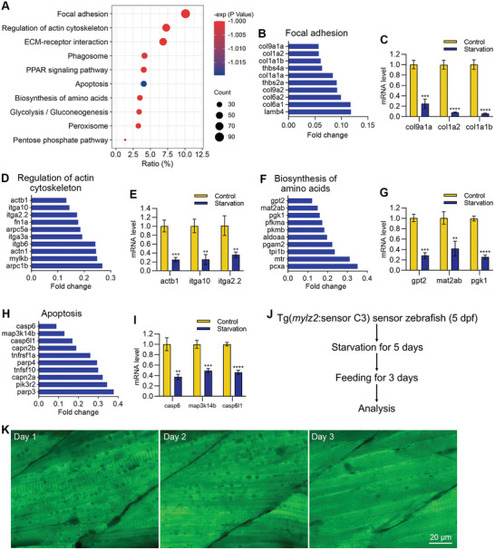
The expression of structural protein‐related genes was down‐regulated, and apoptosis‐related genes were inhibited during starvation‐induced muscle atrophy. A) The enrichment analysis shows the down‐regulated pathways during starvation‐induced muscle atrophy. B–I) RNA sequencing and qPCR results show the mRNA levels of down‐regulated genes in four pathways after starvation treatment. J) Refeeding the zebrafish after starvation treatment. K) FRET imaging shows the disappearance of autophagic vacuoles after refeeding. The size of the scale bar is shown in the image. ** |
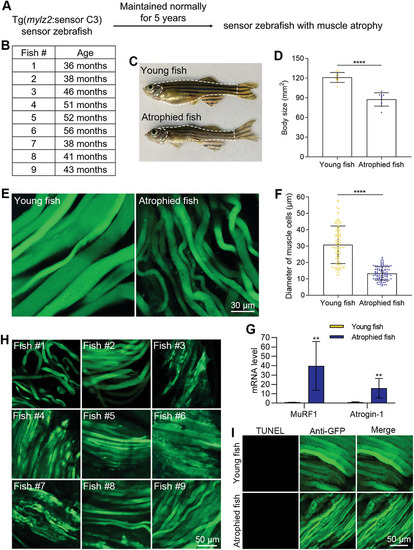
Apoptosis was not involved in the process of muscle atrophy during natural aging. A) The muscle atrophy model induced by natural aging. B) The ages of zebrafish when they were sacrificed. C) Morphologies of healthy young zebrafish and naturally aged zebrafish with muscle atrophy. D) The quantified results show the decrease in the body size of atrophied zebrafish (n = 9 zebrafish for each group). E) The decrease of the diameter of muscle cells in atrophied zebrafish. F) The quantified results show the decrease of the muscle cells in atrophied zebrafish (n = 90 cells from 9 zebrafish for each group). G) The mRNA levels of muscle atrophy markers in young and atrophied zebrafish. H) FRET imaging shows no obvious blue apoptotic signals from atrophied zebrafish. I) TUNEL assays show no muscle cell apoptosis in atrophied zebrafish. The size of each scale bar is indicated in each image. ** |
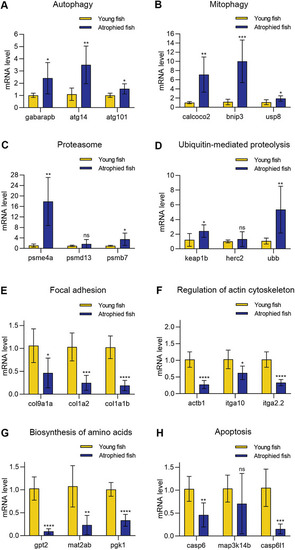
The mRNA levels of 24 genes in natural aging‐induced muscle atrophy. A–D) The genes related to autophagy, mitophagy, proteasome, and ubiquitin‐mediated proteolysis were up‐regulated. E–H) The genes related to focal adhesion, regulation of actin cytoskeleton, biosynthesis of amino acids, and apoptosis were down‐regulated. * |