
Image
|
Figure Caption
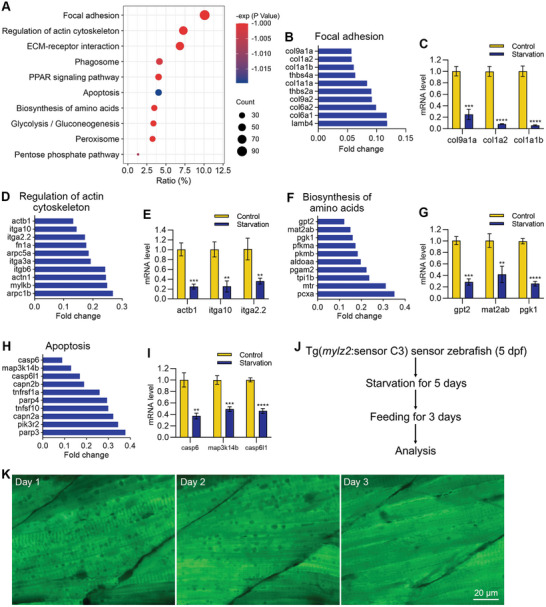
Figure 6
The expression of structural protein‐related genes was down‐regulated, and apoptosis‐related genes were inhibited during starvation‐induced muscle atrophy. A) The enrichment analysis shows the down‐regulated pathways during starvation‐induced muscle atrophy. B–I) RNA sequencing and qPCR results show the mRNA levels of down‐regulated genes in four pathways after starvation treatment. J) Refeeding the zebrafish after starvation treatment. K) FRET imaging shows the disappearance of autophagic vacuoles after refeeding. The size of the scale bar is shown in the image. **
Acknowledgments
This image is the copyrighted work of the attributed author or publisher, and
ZFIN has permission only to display this image to its users.
Additional permissions should be obtained from the applicable author or publisher of the image.
Full text @ Adv Sci (Weinh)