
|
Figure 5
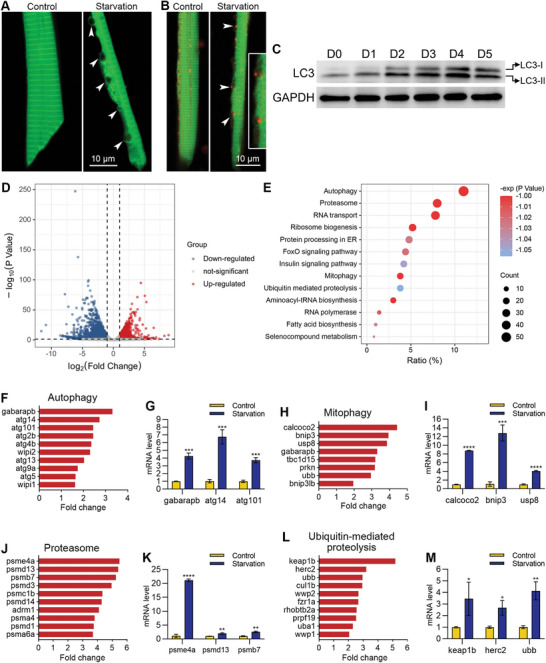
Muscle cells underwent autophagy during starvation‐induced muscle atrophy. A) High‐resolution imaging showing the unique morphology of an autophagic muscle cell. Autophagic vacuoles are indicated with arrowheads. B) Colocalization of autophagic vacuoles and lysosomes. Lysosomes are labeled with LysoTracker red, and autophagic vacuoles are indicated with arrowheads. The two autophagic vacuoles in the middle are enlarged for better illustration. C) Western blotting shows the increase of LC3‐II during starvation treatment. D) A volcano map showing the differentially expressed genes. E) The enrichment analysis shows that the autophagy pathway ranks at the top of up‐regulated genes during starvation‐induced muscle atrophy. F–M) RNA sequencing and qPCR results show the mRNA levels of up‐regulated genes in four pathways after starvation treatment. The size of each scale bar is indicated in each image. *