
- Title
-
Thyroxine (T3)-mediated regulation of early cardiac repair in a chemical-induced hypoxia/reoxygenation model of adult zebrafish (Danio rerio)
- Authors
- Banerjee, K., Mandal, S., Nath, A., Chakraborty, S.B., Mitra, A., Gupta, S.
- Source
- Full text @ Wound Repair Regen.
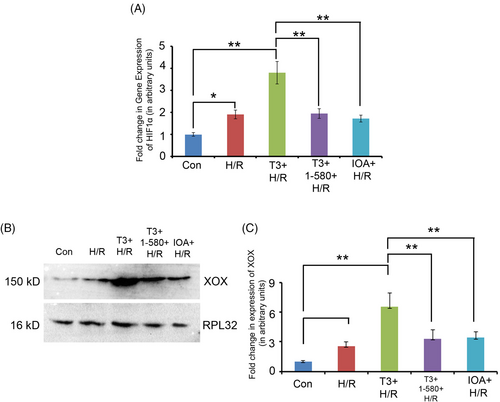
(A) Graph showing relative change in the expression of hypoxia marker HIF 1α in different experimental groups as revealed by qRT-PCR analysis (*p < 0.05; **p < 0.01). (B) Western blot analysis and (C) corresponding graph showing change in the expression of ischemia marker xanthine oxidase (XOX) in different experimental groups (*p < 0.05; **p < 0.01). |
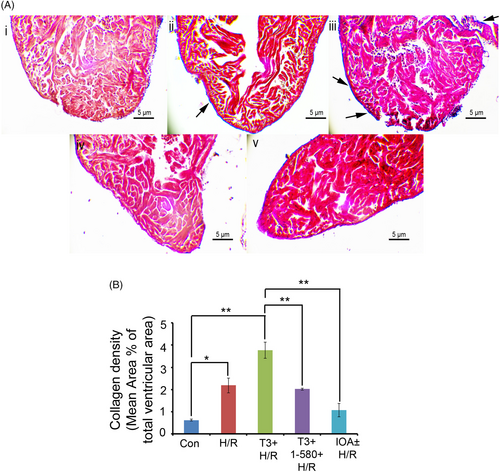
(A) Representative images showing cardiac sections from different experimental groups stained with Masson's trichrome stain (Scale bar = 5 μm). Arrowheads indicate areas of collagen deposition. (B) ImageJ analysis revealed only 0.62 ± 0.03% of collagen density in control. Hypoxia/reoxygenation resulted in an increased collagen density of 2.18 ± 0.33%. T3 pre-treatment during hypoxia/reoxygenation caused more pronounced collagen density of 3.77 ± 0.35%. However, T3 inhibition along with T3 pre-treatment resulted in significantly reduced collagen density of 2.02 ± 0.05% in comparison with T3 + H/R Group. Collagen density in iopanoic acid (IOA)-treated samples (IOA+ H/R Group) was found to be 1.07 ± 0.3%, which is significantly low in comparison with H/R group (*p < 0.05; **p < 0.01). |
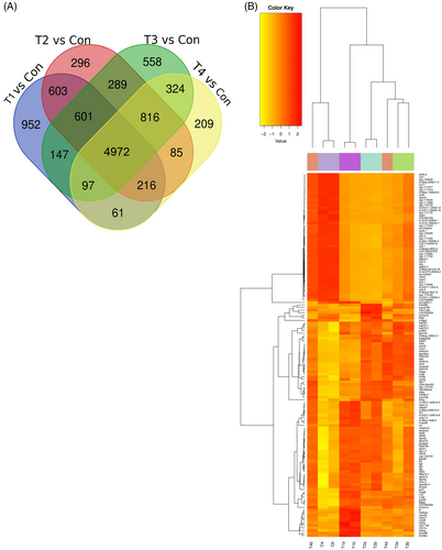
Differentially expressed genes among experimental groups: (A) Venn diagram showing number of altered genes in the microarray analysis among Control (Con), H/R Group (T1), T3 + H/R Group (T2), T3 + 1–580 + H/R Group (T3) and IOA+ H/R Group (T4) samples. Data are shown as comparison between groups Con and T1, Con and T2, Con and T3 and Con and T4. (B) Comparative profile of altered genes: Heat map depicting a comparative profile of altered genes belonging to different functional groups. |
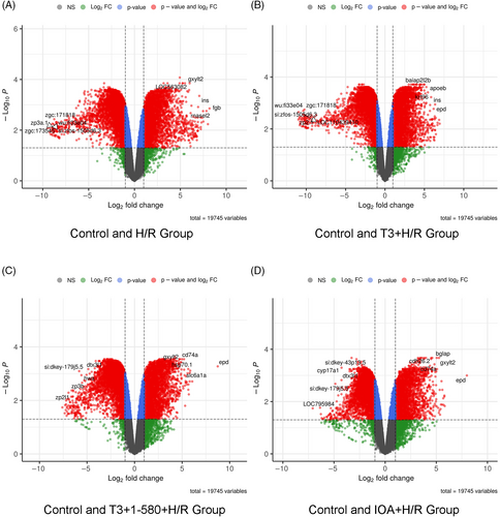
Volcano plots showing DEGs of identified during microarray analysis. In the plot, each point represents a gene, with the x-axis showing the fold change in expression and the y-axis showing the statistical significance of the difference, represented as the negative logarithm of the p value. The criteria of DEG was |logFC| >1 and p value <0.05. Red dots represent genes or features that are significantly up-regulated or down-regulated in a treatment group in comparison with control. Blue dots represent genes with p value <0.05 but |logFC| <1. Green dots represent genes with |logFC| >1 but p value >0.05. Grey dots represent genes with |logFC| <1 and p value >0.05. Data are shown as comparison between (A) Control and H/R Group, (B) Control and T3 + H/R Group, (C) Control and T3 + 1–580 + H/R Group; (D) Con and IOA+ H/R Group. |
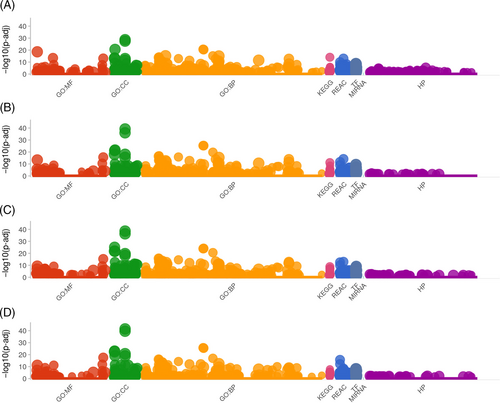
Manhattan plot illustrating the differentially expressed gene-enriched GO terms (BP, biological process; CC, cellular component; MF, molecular function) and KEGG pathways across reactome pathways (REAC), transcription factor (TF), microRNA target base (MIRNA) and human phenotype ontology (HP) term categories among different experimental groups. Data are shown as comparison between (A) Control and H/R Group, (B) Control and T3 + H/R Group, (C) Control and T3 + 1–580 + H/R Group; (D) Control and IOA+ H/R Group. |
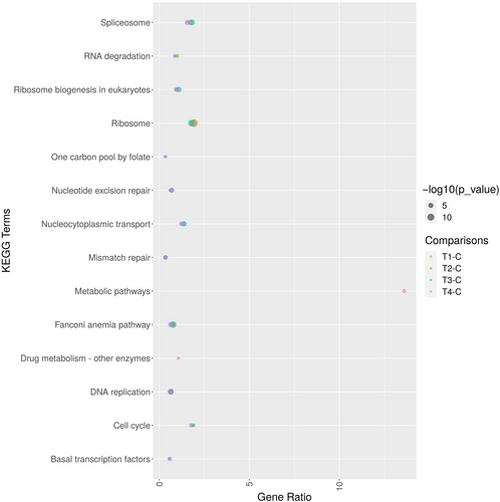
KEGG enrichment analysis: Bubble plot showing the top enriched terms in KEGG pathway among Control (Con), H/R Group, T3 + H/R Group, T3 + 1–580 + H/R Group and IOA+ H/R Group. Each enriched pathway is represented as a bubble. The size of the bubble corresponds to the number of genes associated with that pathway. |
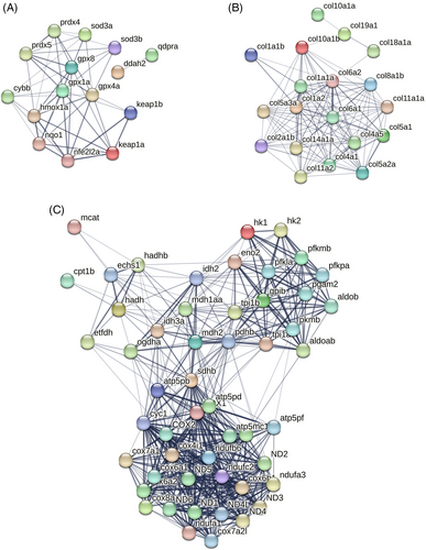
STRING network of DEGs related to (A) Oxidative stress, (B) Collagen, (C) Energy metabolism. Connections reflect physical protein interactions. Active interaction sources used are—text mining, experiments and databases. |
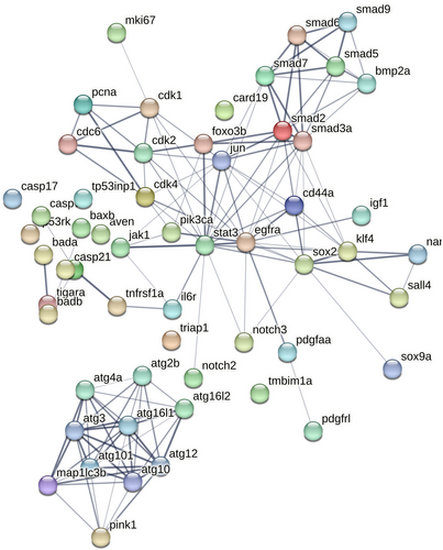
STRING network of DEGs related to apoptosis, autophagy and regeneration. Connections reflect physical protein interactions. Active interaction sources used are—text mining, experiments and databases. |
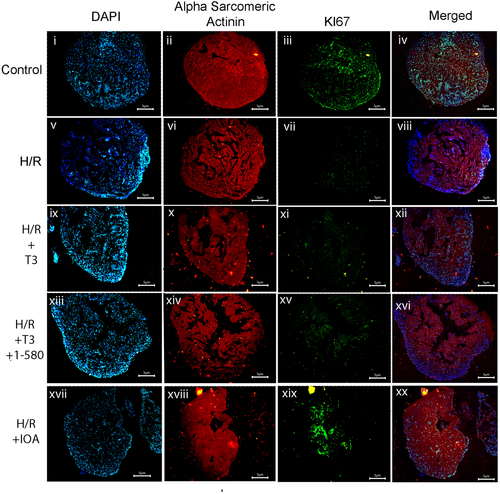
Immunofluorescence study showing decreased nuclear expression of Ki67 in T3 + H/R or H/R alone compared to control in cardiac tissue sections. Tissue sections were incubated with primary antibodies against Ki67 (Parts iii, vii, xi, xv, xix) followed by Alexa fluor 488 secondary antibody. All the sections were counter stained with alpha sarcomeric actinin antibody (Parts iii, vii, xi) followed by Alexa fluor 633 secondary antibody (ii, vi, x, xiv, xviii) and nuclei with DAPI (Parts I, v, ix, xiii, xvii). Parts iv, viii, xii, xvi and xx show merged images (scale bar = 5 μm). |
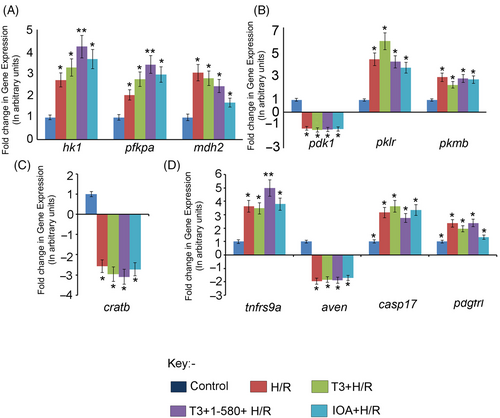
Graph showing relative change in the expression of a few representative genes in different experimental groups as revealed by qRT-PCR analysis. (A) DEGs related to Glycolysis and Krebs Cycle—hexokinase 1 (hk1); phosphofructokinase, platelet a (pfkpa); malate dehydrogenase 2 and NAD (mitochondrial) (mdh2). (B) DEGs related to Pyruvate metabolism—pyruvate dehydrogenase kinase, isozyme 1 (pdk1); pyruvate kinase L/R (pklr) and pyruvate kinase M1/2b (pkmb). (C) DEG related to fatty acid oxidation—carnitine O-acetyltransferase b (cratb). (D) DEGs related to apoptosis and regeneration—tumour necrosis factor receptor superfamily, member 9a (tnfrsf9a); apoptosis, caspase activation inhibitor (aven); caspase 17, apoptosis-related cysteine peptidase (casp17) and platelet-derived growth factor receptor-like (pdgfrl). Data are shown as comparison between groups Con and H/R Group, Con and T3 + H/R Group, Con and T3 + 1–580 + H/R Group and Con and IOA+ H/R Group (*p < 0.05; **p < 0.01). |