
|
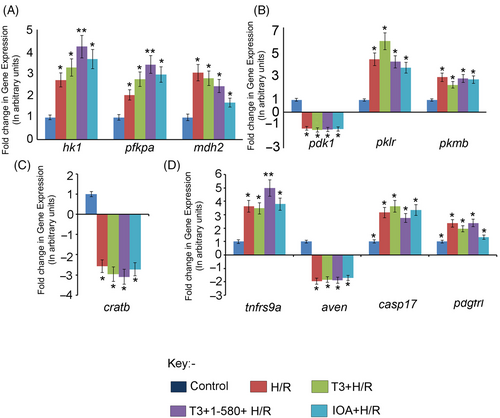
Fig. 10 Graph showing relative change in the expression of a few representative genes in different experimental groups as revealed by qRT-PCR analysis. (A) DEGs related to Glycolysis and Krebs Cycle—hexokinase 1 (hk1); phosphofructokinase, platelet a (pfkpa); malate dehydrogenase 2 and NAD (mitochondrial) (mdh2). (B) DEGs related to Pyruvate metabolism—pyruvate dehydrogenase kinase, isozyme 1 (pdk1); pyruvate kinase L/R (pklr) and pyruvate kinase M1/2b (pkmb). (C) DEG related to fatty acid oxidation—carnitine O-acetyltransferase b (cratb). (D) DEGs related to apoptosis and regeneration—tumour necrosis factor receptor superfamily, member 9a (tnfrsf9a); apoptosis, caspase activation inhibitor (aven); caspase 17, apoptosis-related cysteine peptidase (casp17) and platelet-derived growth factor receptor-like (pdgfrl). Data are shown as comparison between groups Con and H/R Group, Con and T3 + H/R Group, Con and T3 + 1–580 + H/R Group and Con and IOA+ H/R Group (*p < 0.05; **p < 0.01).