
Image
|
Figure Caption
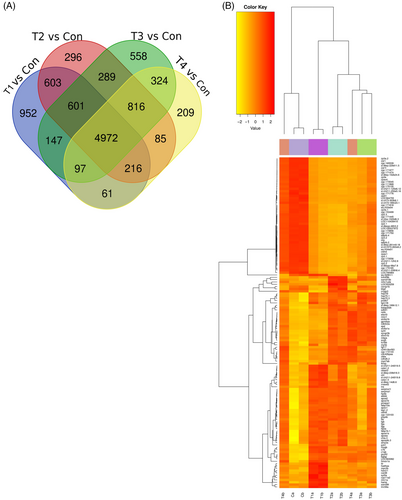
Fig. 3 Differentially expressed genes among experimental groups: (A) Venn diagram showing number of altered genes in the microarray analysis among Control (Con), H/R Group (T1), T3 + H/R Group (T2), T3 + 1–580 + H/R Group (T3) and IOA+ H/R Group (T4) samples. Data are shown as comparison between groups Con and T1, Con and T2, Con and T3 and Con and T4. (B) Comparative profile of altered genes: Heat map depicting a comparative profile of altered genes belonging to different functional groups.
Acknowledgments
This image is the copyrighted work of the attributed author or publisher, and
ZFIN has permission only to display this image to its users.
Additional permissions should be obtained from the applicable author or publisher of the image.
Full text @ Wound Repair Regen.