
|
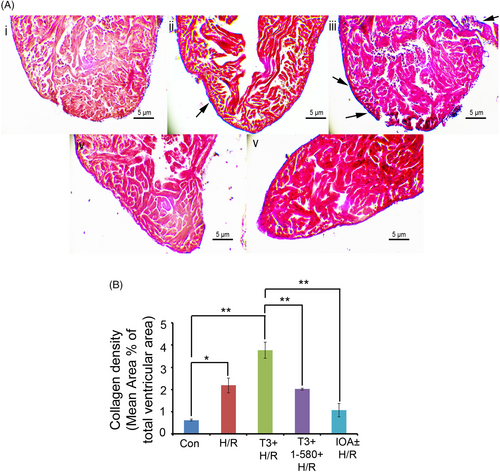
Fig. 2 (A) Representative images showing cardiac sections from different experimental groups stained with Masson's trichrome stain (Scale bar = 5 μm). Arrowheads indicate areas of collagen deposition. (B) ImageJ analysis revealed only 0.62 ± 0.03% of collagen density in control. Hypoxia/reoxygenation resulted in an increased collagen density of 2.18 ± 0.33%. T3 pre-treatment during hypoxia/reoxygenation caused more pronounced collagen density of 3.77 ± 0.35%. However, T3 inhibition along with T3 pre-treatment resulted in significantly reduced collagen density of 2.02 ± 0.05% in comparison with T3 + H/R Group. Collagen density in iopanoic acid (IOA)-treated samples (IOA+ H/R Group) was found to be 1.07 ± 0.3%, which is significantly low in comparison with H/R group (*p < 0.05; **p < 0.01).