
Image
|
Figure Caption
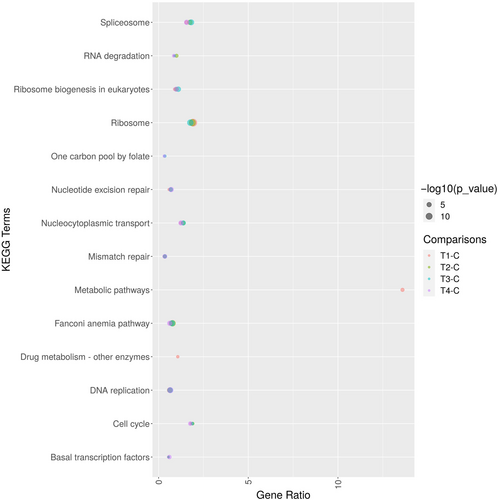
Fig. 6 KEGG enrichment analysis: Bubble plot showing the top enriched terms in KEGG pathway among Control (Con), H/R Group, T3 + H/R Group, T3 + 1–580 + H/R Group and IOA+ H/R Group. Each enriched pathway is represented as a bubble. The size of the bubble corresponds to the number of genes associated with that pathway.
Acknowledgments
This image is the copyrighted work of the attributed author or publisher, and
ZFIN has permission only to display this image to its users.
Additional permissions should be obtained from the applicable author or publisher of the image.
Full text @ Wound Repair Regen.