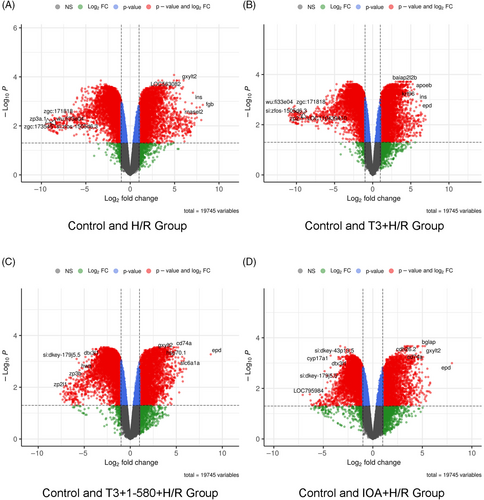
Fig. 4 Volcano plots showing DEGs of identified during microarray analysis. In the plot, each point represents a gene, with the x-axis showing the fold change in expression and the y-axis showing the statistical significance of the difference, represented as the negative logarithm of the p value. The criteria of DEG was |logFC| >1 and p value <0.05. Red dots represent genes or features that are significantly up-regulated or down-regulated in a treatment group in comparison with control. Blue dots represent genes with p value <0.05 but |logFC| <1. Green dots represent genes with |logFC| >1 but p value >0.05. Grey dots represent genes with |logFC| <1 and p value >0.05. Data are shown as comparison between (A) Control and H/R Group, (B) Control and T3 + H/R Group, (C) Control and T3 + 1–580 + H/R Group; (D) Con and IOA+ H/R Group.
Image
Figure Caption
Acknowledgments
This image is the copyrighted work of the attributed author or publisher, and
ZFIN has permission only to display this image to its users.
Additional permissions should be obtained from the applicable author or publisher of the image.
Full text @ Wound Repair Regen.

