
Image
|
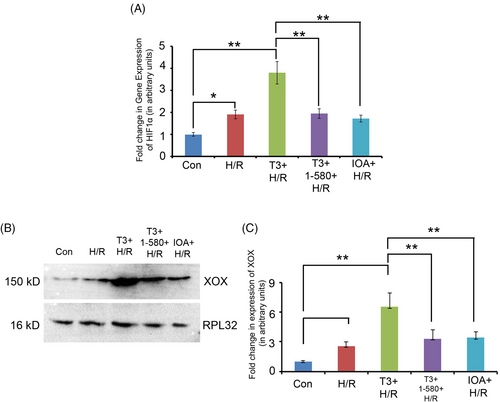
Figure Caption
Fig. 1 (A) Graph showing relative change in the expression of hypoxia marker HIF 1α in different experimental groups as revealed by qRT-PCR analysis (*p < 0.05; **p < 0.01). (B) Western blot analysis and (C) corresponding graph showing change in the expression of ischemia marker xanthine oxidase (XOX) in different experimental groups (*p < 0.05; **p < 0.01).
Acknowledgments
This image is the copyrighted work of the attributed author or publisher, and
ZFIN has permission only to display this image to its users.
Additional permissions should be obtained from the applicable author or publisher of the image.
Full text @ Wound Repair Regen.