
- Title
-
The unique structure of the zebrafish TNF-α homotrimer
- Authors
- Duan, Y., Wang, Y., Li, Z., Ma, L., Wei, X., Yang, J., Xiao, R., Xia, C.
- Source
- Full text @ Dev. Comp. Immunol.
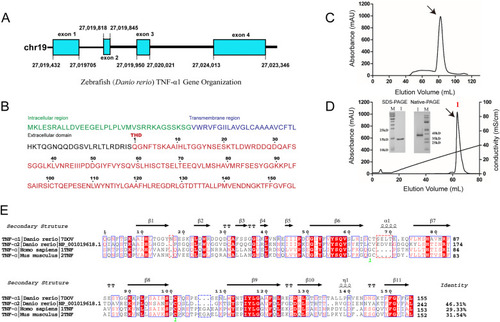
Sequence analysis and alignment of the zebrafish TNF-α1 (zTNF-α1) gene. (A) zTNF-α1 gene organization. The exon is represented by a square, the intron is represented by a line, and their lengths are indicated in the graph. (B) The amino acid sequence of zTNF-α1. The different domains of zTNF-α1 are marked with the indicated colors. (C) Gel filtration chromatograms of the zTNF-α1 protein. The abscissa shows the peak volume (ml), whereas the ordinate represents the UV intensity (mAU). (D) Resource Q anion-exchange chromatography for the purification of the expressed zTNF-α1 protein. The zTNF-α1 monomer detected by SDS-PAGE and the zTNF-α1 trimer detected by native PAGE. (E) Multiple sequence alignment of zTNF-α1 (PDB ID: 7DOV), zTNF-α2 (GenBank: NP_001019618.1), mouse TNF-α (mTNF-α, PDB ID: 2TNF) and human TNF-α (hTNF-α, PDB ID: 1TNF). Arrows above the alignment indicate β-strands, and cylinders indicate helixes. The inserted residues of zTNF-α1 are framed in the red dotted box, and the inserted residues of mammals are framed in the blue dotted box. The total amino acid identities between zTNF-α1 and the listed TNF-α sequences are shown to the right of each sequence. |
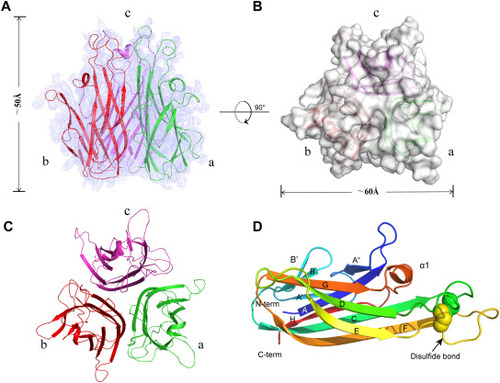
Structural characteristics of the zTNF-α1 trimer. (A) Overview of the electron density map (2Fo - Fc) at 2.6 Å (contoured at 1.5σ) with the refined model superimposed. The threefold axis lies vertically. Double-sided arrows indicate the height of the complex. (B) Top view of the structural surface of trimeric zTNF-α1. Double-sided arrows indicate the width of the complex. (C) A top view of the trimeric zTNF-α1 structure is shown in the cartoon representation. (D) Monomeric zTNF-α1 is colored blue to red from the N-terminus to the C-terminus, as shown in the cartoon representation. Secondary structure elements and disulfides are labeled. |
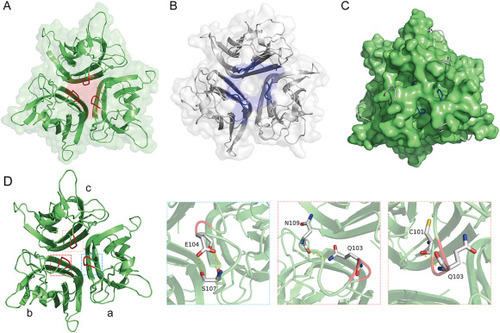
The unique topological structure of the zTNF-α1 trimer. (A) Top view of the trimeric zTNF-α1 structure colored green. The part of the EF loop at the top that folds inward into the trimer channel is colored red. (B) Top view of the trimeric hTNF-α structure colored light gray. The part of the EF loop at the top is colored blue. (C) Superposition of the structure of zTNF-α1 (surface) with the structure of hTNF-α (cartoon). The EF loops of hTNF-α protrude outward at the three corresponding holes formed around the top of the zTNF-α1 trimer. (D) The interaction between residues 103–104 in the EF loop (colored in red) and adjacent amino acids. Key residues forming hydrogen bonds are shown as sticks. Hydrogen bonds are indicated with a yellow dashed line. The corresponding residues are labeled with amino acid abbreviations and primary sequence numbers. |
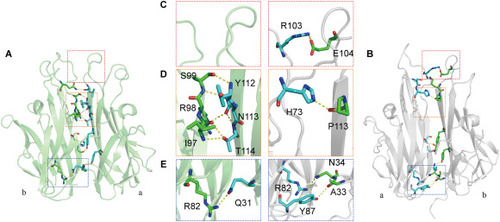
Comparison of the hydrogen-bonding network between the zTNF-α1 and hTNF-α monomers. (A) Hydrogen-bonding network between the monomers of zTNF-α1. The residues involved are represented in stick form. Hydrogen bonds are indicated with a yellow dashed line. (B) Hydrogen-bonding network between the monomers of hTNF-α. (C, D and E) Comparison of hydrogen bonding between the different regions of zTNF-α1 and hTNF-α: the top loop region (C), the near top loop region (D) and the bottom region (E). |
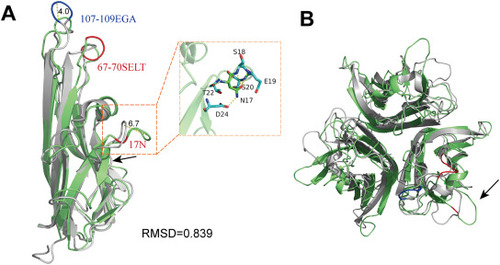
Structural superposition of zTNF-α1 and hTNF-α. (A) Structural superposition of zTNF-α1 and hTNF-α monomers. zTNF-α1 is shown in green. hTNF-α is shown in light gray. The black arrow indicates the additional β-strand in zTNF-α1. hTNF-α has three amino acid insertions at positions 107–109, which are indicated in blue. The amino acid insertions at positions 17 and 67–70 of zTNF-α1 are shown in red, and the corresponding distances are indicated by yellow dashed lines and labeled with the length in angstroms. The insert on the right shows the key residues interacting with 17N resulting in hydrophobic oligomerization, which are shown as sticks. Hydrogen bonds are indicated with a yellow dashed line. (B) Top view of the structural alignment of the zTNF-α1 trimer and the hTNF-α trimer. The black arrow indicates the region folding outward resulting from 17N. |
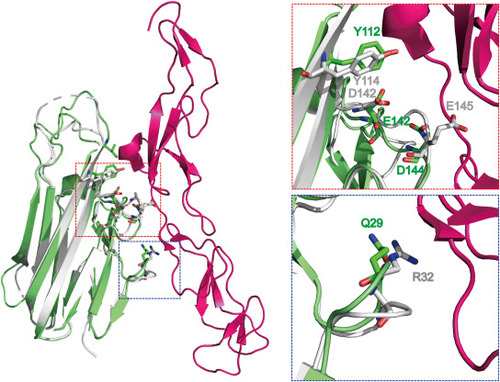
Model of the complex of zTNF-α1 and the hTNFR1 receptor. The structure of zTNF-α1 is overlapped with the mTNF-α/hTNFR1 complex (PDBID:7KP8) structure. The insert on the left shows the interaction of the mTNF-α/hTNFR1 complex and the zTNF-α1/hTNFR1 model. hTNFR1 is displayed in hot pink, mTNF-α is displayed in white, and zTNF-α1 is displayed in green. The residues at the interaction interface are shown as sticks. The insert on the right shows the conserved amino acids in a box to the left. |
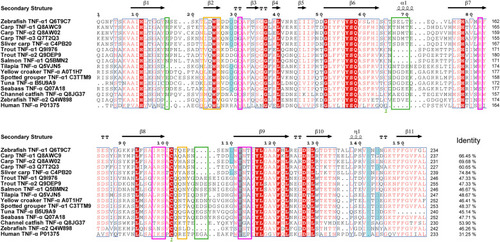
Multiple sequence alignment of TNF-α sequences among teleost fishes. Residues are numbered according to the sequence of zTNF-α1. Arrows above the alignment indicate β-strands, and cylinders indicate helixes. The total amino acid sequence identities between zTNF-α1 and the listed fish TNF-α sequences are shown to the right of the sequences. Blue highlighting indicates that the TNF-α residues that may interact with receptors are conserved in teleost fish. Hot pink indicates residues involved in the interactions between trimers that differ from those in humans. Green indicate inserted or deleted amino acids in this region compared with those in the human sequence. Orange markings indicate the unique structural characteristics of the amino acids of zTNF-α1. |