
Image
|
Figure Caption
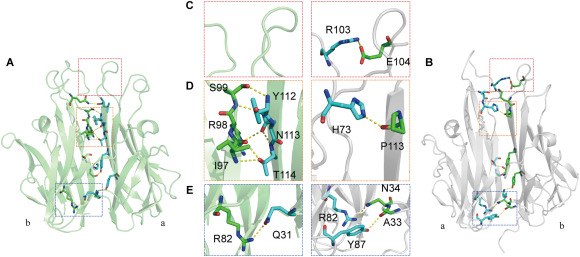
Fig. 4 Comparison of the hydrogen-bonding network between the zTNF-α1 and hTNF-α monomers. (A) Hydrogen-bonding network between the monomers of zTNF-α1. The residues involved are represented in stick form. Hydrogen bonds are indicated with a yellow dashed line. (B) Hydrogen-bonding network between the monomers of hTNF-α. (C, D and E) Comparison of hydrogen bonding between the different regions of zTNF-α1 and hTNF-α: the top loop region (C), the near top loop region (D) and the bottom region (E).
Acknowledgments
This image is the copyrighted work of the attributed author or publisher, and
ZFIN has permission only to display this image to its users.
Additional permissions should be obtained from the applicable author or publisher of the image.
Full text @ Dev. Comp. Immunol.