
Fig. 1
- ID
- ZDB-FIG-211122-1
- Publication
- Duan et al., 2021 - The unique structure of the zebrafish TNF-α homotrimer
- Other Figures
- All Figure Page
- Back to All Figure Page
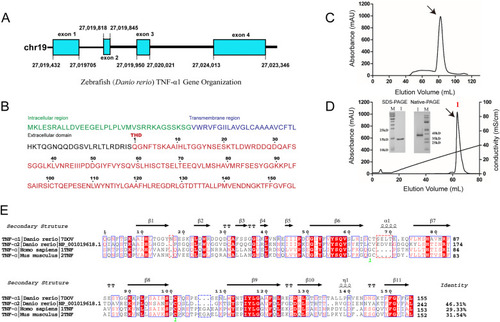
Sequence analysis and alignment of the zebrafish TNF-α1 (zTNF-α1) gene. (A) zTNF-α1 gene organization. The exon is represented by a square, the intron is represented by a line, and their lengths are indicated in the graph. (B) The amino acid sequence of zTNF-α1. The different domains of zTNF-α1 are marked with the indicated colors. (C) Gel filtration chromatograms of the zTNF-α1 protein. The abscissa shows the peak volume (ml), whereas the ordinate represents the UV intensity (mAU). (D) Resource Q anion-exchange chromatography for the purification of the expressed zTNF-α1 protein. The zTNF-α1 monomer detected by SDS-PAGE and the zTNF-α1 trimer detected by native PAGE. (E) Multiple sequence alignment of zTNF-α1 (PDB ID: 7DOV), zTNF-α2 (GenBank: NP_001019618.1), mouse TNF-α (mTNF-α, PDB ID: 2TNF) and human TNF-α (hTNF-α, PDB ID: 1TNF). Arrows above the alignment indicate β-strands, and cylinders indicate helixes. The inserted residues of zTNF-α1 are framed in the red dotted box, and the inserted residues of mammals are framed in the blue dotted box. The total amino acid identities between zTNF-α1 and the listed TNF-α sequences are shown to the right of each sequence. |