
Image
|
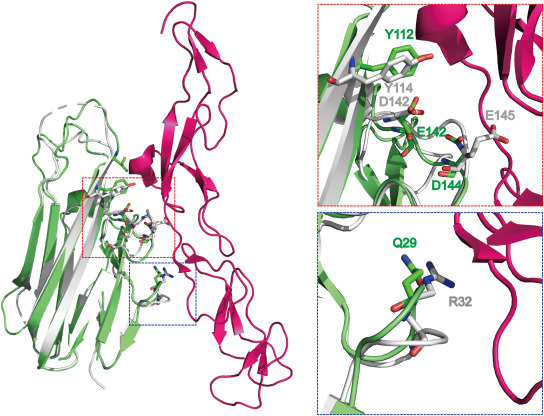
Figure Caption
Fig. 6 Model of the complex of zTNF-α1 and the hTNFR1 receptor. The structure of zTNF-α1 is overlapped with the mTNF-α/hTNFR1 complex (PDBID:7KP8) structure. The insert on the left shows the interaction of the mTNF-α/hTNFR1 complex and the zTNF-α1/hTNFR1 model. hTNFR1 is displayed in hot pink, mTNF-α is displayed in white, and zTNF-α1 is displayed in green. The residues at the interaction interface are shown as sticks. The insert on the right shows the conserved amino acids in a box to the left.
Acknowledgments
This image is the copyrighted work of the attributed author or publisher, and
ZFIN has permission only to display this image to its users.
Additional permissions should be obtained from the applicable author or publisher of the image.
Full text @ Dev. Comp. Immunol.