|
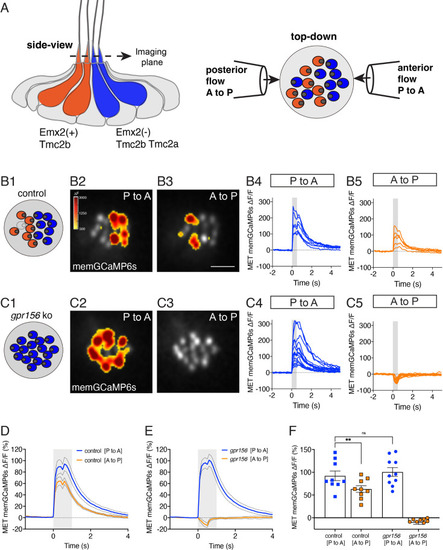
Gpr156 impacted the mechanosensitive properties of lateral-line HCs. (A) Schematic on the left shows a lateral-line neuromast from the side. HCs that detect anterior (P to A) and posterior (A to P) flow are color coded in blue and orange respectively. Posterior-sensitive HCs do not express Emx2 and rely primarily on the MET channel subunits Tmc2a and Tmc2b. In contrast, anterior-sensitive HCs express Emx2 and rely primary on Tmc2b for mechanosensation. Schematic on the right shows a plane taken through the apical hair bundle plane, viewed top-down. The directional sensitivity of each HC is dictated by the location of the kinocilium, which is indicated by the circle on the side of each hair bundle. This apical plane is one used to monitor mechanosensitive-calcium signals in lateral-line hair bundles. The pipettes on each side of the hair bundles show the direction of flow delivered to stimulate the two populations of HCs. (B1–B5) Representative example of evoked-mechanosensitive calcium signals in hair bundles of a control neuromast during a 500 ms anterior (B2) or a 500 ms posterior (B3) directed stimulus. Spatial patterns of GCaMP6s signals during stimulation (B2–B3) are colorized according to the ∆F heat map and superimposed onto a baseline GCaMP6s image. In B1, the colored circles indicate the respective hair bundle orientation observed from calcium imaging (A to P, orange; P to A, blue; no response, gray). ROIs were placed on each hair bundle to generate the ∆F/F GCaMP6s traces from individual hair bundles responding to P to A (B4) and A to P (B5) directed flow. (C1–C5) Representative example of evoked-mechanosensitive calcium signals in hair bundles of a gpr156 mutant neuromast during a 500 ms P to A (C2) or a 500 ms A to P (C3) directed stimulus. Spatial patterns of GCaMP6s signals during stimulation (C2–C3) are colorized according to the ∆F heat map in B2 and superimposed onto a baseline GCaMP6s image. In C1, the colored circles indicate the respective hair bundle orientation observed from calcium imaging (P to A, blue). ROIs were placed on all hair bundle to generate the ∆F/F GCaMP6s traces from individual hair bundles during P to A (C4) and A to P (C5) directed stimuli. (D–F) Quantification of the average increase in GCaMP6s per neuromast for P to A and A to P responding hair bundles. Traces in D and E show the average GCaMP6s response per neuromast in P to A and A to P hair-bundle populations (mean ± SEM is shown in D–E, n=9 control and 10 gpr156 neuromasts). The magnitude of the GCaMP6s data in D–E is plotted to compare the average GCaMP6s increase for P to A and A to P hair bundles for each neuromast in F. In control neuromasts, the GCaMP6s increase in the hair bundles responding to P to A flow was larger compared to those responding to A to P flow. In gpr156 mutants the GCaMP6s increase in hair bundles responding to P to A flow was significantly larger than control A to P cells, but not different than control P to A cells. **p=0.0043 and p=0.561, paired and unpaired t-test respectively. Scale bar is 5 μm in B3.
|